

KPI Trees: Turning Goals into Metrics
When teams set big goals but struggle to track real progress, the culprit is often a missing bridge between strategy and measurement. A KPI tree is that bridge. It visualizes how a top-level objective breaks into drivers and sub-drivers until you reach measurable indicators any team can influence day-to-day. The result is clarity: everyone sees how their work ladders to outcomes, which metrics matter, and how to course-correct quickly. (See comparisons with OKRs and Balanced Scorecard below for where a KPI tree fits in your stack.)
In short
A KPI tree turns ambition into a model you can measure.
What is a KPI tree (and why it works)
A KPI tree is a hierarchical map that links a top outcome (e.g., profitable growth) to the factors that drive it (e.g., acquisition, retention, unit economics), and then to operational metrics (e.g., conversion rate, activation rate, NPS, CAC/LTV). Each branch shows a cause-and-effect pathway from work to results, creating line-of-sight between teams and strategy.
KPI trees work because they force teams to articulate assumptions about what actually moves the top metric. They also expose conflicts (e.g., lowering CAC may hurt lead quality) so you can balance targets early.
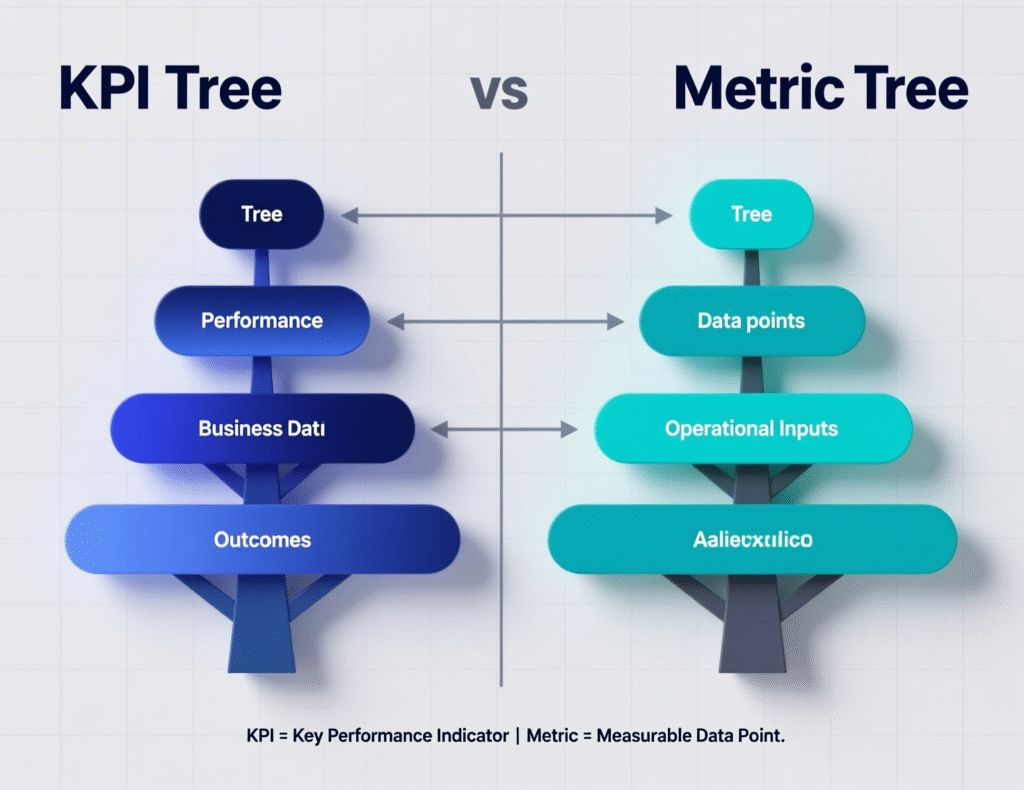
KPI tree vs. metric tree
You’ll often hear “metric tree” used interchangeably with KPI tree, but they’re different tools. A metric tree focuses on how metrics relate operationally (e.g., Revenue = Price × Volume; Volume = Sessions × Conversion × AOV). A KPI tree, by contrast, centers on strategic outcomes and the key indicators you choose to monitor progress toward them. Use metric trees when you’re modeling numbers; use a KPI tree when you’re aligning work to strategy.
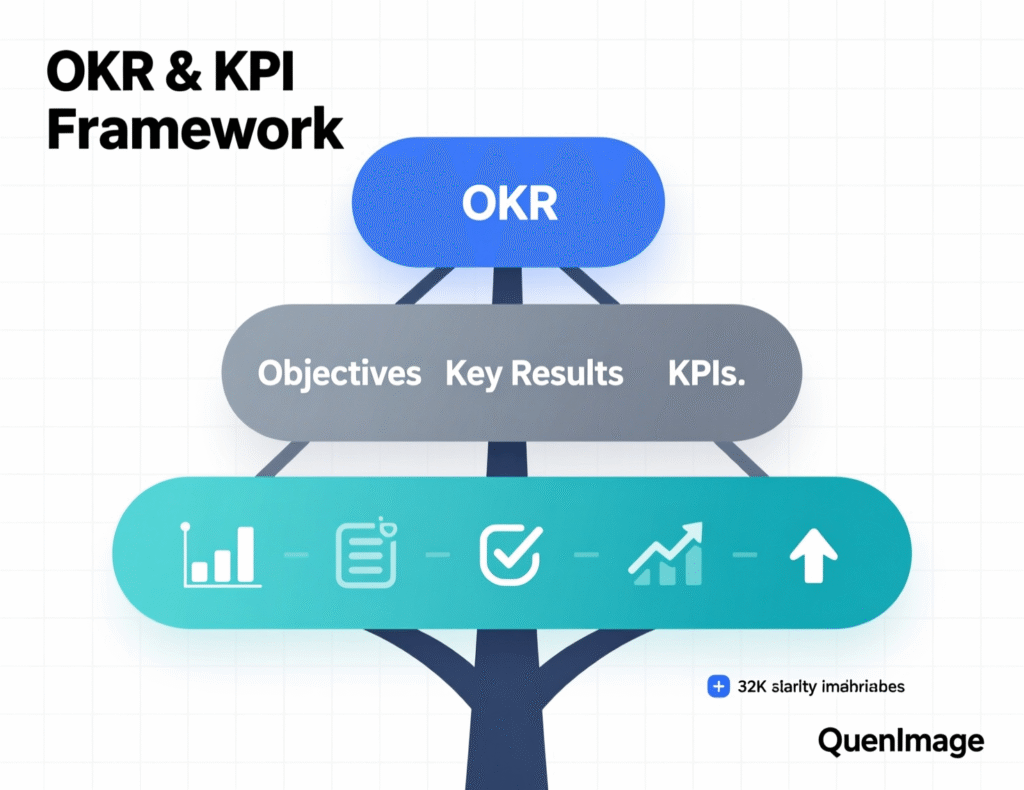
KPI tree vs. OKRs and the Balanced Scorecard
-
OKRs
Are a goal-setting framework (Objectives + Key Results) to drive change; KPIs are ongoing indicators of performance. They’re complementary: OKRs set direction, KPIs tell you if you’re on track. A KPI tree makes these relationships explicit. -
Balanced Scorecard
Structures strategy across four perspectives (Financial, Customer, Internal Processes, Learning & Growth). A KPI tree can be used inside each perspective to model cause-and-effect drivers of results. Harvard Business Review+1
How to build a KPI tree (step-by-step)
Follow these seven steps to produce a robust, testable KPI tree in a single working session:
Start with the north-star outcome
Pick one top KPI (e.g., Net Revenue Retention, Gross Profit, Completed Orders). Make it unambiguous and time-bound.
List primary drivers
Identify 3–5 big levers that materially move the top KPI (e.g., Acquisition, Activation, Retention, Monetization). Keep it to first-principles math where possible (e.g., Revenue = Users × ARPU).
Decompose each driver into sub-drivers
Example: Acquisition → traffic × conversion × approval rate; Retention → activation × habit × satisfaction. This is where your metric tree math can underpin the KPI tree narrative.
Attach measurable KPIs at the leaves
Choose the fewest, clearest measures that teams can influence: signup conversion, Day-7 activation, weekly active rate, churn %, ARPA, NPS.
Define ownership and telemetry
For every leaf KPI, assign a team, a dashboard source, and a refresh cadence.
Set targets and guardrails
Targets create focus; guardrails (e.g., “don’t let approval rate drop below 80%”) prevent local optimizations from hurting the whole. This is inspired by Balanced Scorecard thinking.
Validate with data and experiments
Use historical data to check if drivers truly correlate with the top KPI; then run small tests to prove causality. Update the KPI tree quarterly.
A simple KPI tree for e-commerce (worked example)
Top KPI.
Gross Profit
Primary drivers.
Order Volume, Average Order Value (AOV), Gross Margin %
Sub-drivers.
-
Order Volume → Sessions × Conversion Rate × Repeat Purchase Rate
-
AOV → Base Basket Size × Cross-sell/Upsell Rate
-
Gross Margin → Product Mix × Supplier Terms × Fulfillment Cost %
Leaf KPIs.
Sessions, Add-to-Cart %, Checkout Conversion %, 30-day repeat %, AOV, margin %, shipping cost/order.
By visualizing this KPI tree, the growth pod can test whether improving cross-sell from 8%→10% or raising repeat purchase from 22%→24% has the bigger profit lift, then prioritize accordingly.
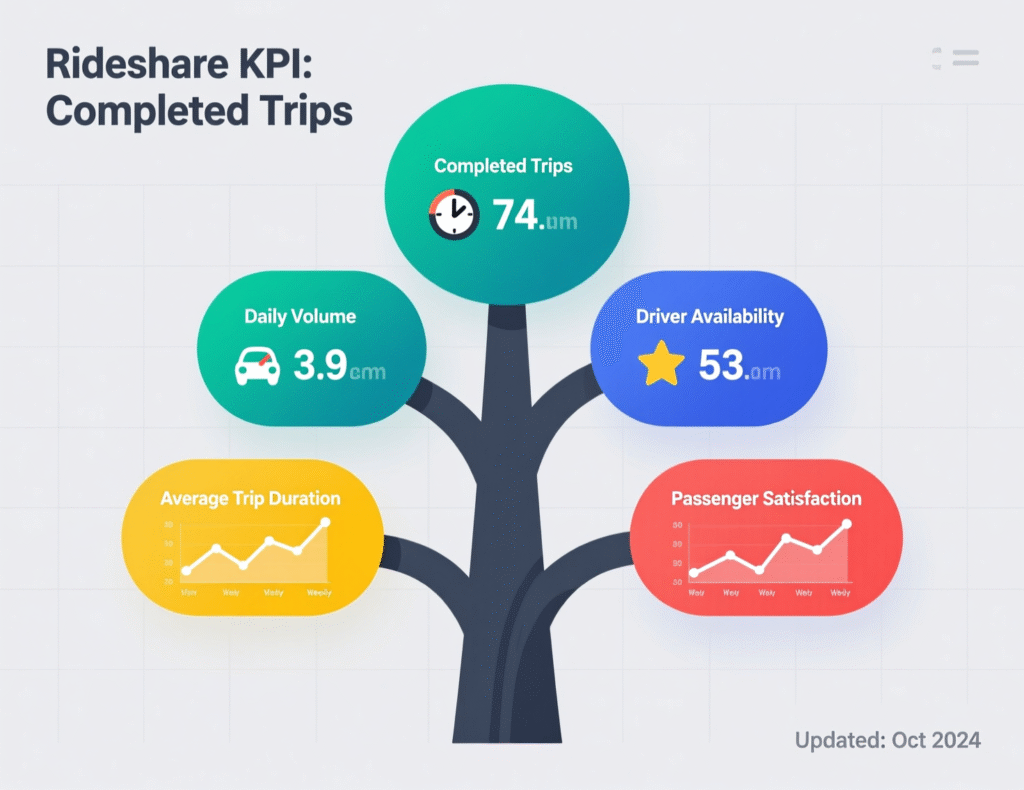
A rideshare-style KPI tree (public example)
Product coach Petra Wille showcases a ride-hailing KPI tree with Completed Trips at the top; branches include rider demand, driver supply, and matching efficiency, with leaf KPIs like wait time, surge minutes, and cancellation rate. Study it to see how an outcome cascades into measurable levers teams can own.
Avoid the 5 most common KPI tree mistakes
Too many leaves.
Pick the vital few; measure the rest ad-hoc.
Vanity metrics.
Views aren’t value. Favor ratio or rate metrics that tie to outcomes.
No owners.
Every leaf needs a team and a dashboard.
Missing guardrails.
Single-metric optimization backfires (e.g., conversion ↑ while returns explode).
Static trees.
Refresh assumptions quarterly; retire dead branches.
KPI tree governance: keep it living
Operationalize your KPI tree in three ways:
-
Rituals
Monthly performance reviews using the tree; quarterly redesign sessions. -
Artifacts
A canonical diagram, glossary, and owners list in your analytics repo and wiki. -
Automation
Dashboards that compute drivers and update traffic-light status without manual work.
For complex businesses, borrow the visual logic of the DuPont ROI model—a century-old tree that decomposed return into margins and asset turns—to pressure-test your structure.
KPI tree + OKR: a practical pairing
Use OKRs to focus change on a specific branch (e.g., Objective: “Delight new users”; Key Results: “Raise Day-7 activation from 42%→55%”). Keep your KPI tree as the enduring map of system health; let OKRs act as seasonal bets to improve the weak links. This combination helps teams avoid “metric drift” while still pushing innovation.
Bottom Lines
A KPI tree is more than a diagram; it’s a shared mental model for how your business creates results. When teams agree on the drivers, instrument the leaves, and review progress regularly, you get faster decisions, better trade-offs, and compounding improvements. Start small, validate assumptions, and evolve the model as your strategy changes the KPI tree will keep everyone aligned on what truly moves the needle.
CTA: Want help facilitating a 90-minute KPI tree sprint with your leadership and data teams? Use the templates below and ship your first draft this week.
FAQs
Q : What is a KPI tree?
A : A KPI tree is a hierarchical diagram linking a top business outcome to its drivers and measurable indicators, giving every team line-of-sight from daily work to strategy.
Q : How do I choose the top KPI for my KPI tree?
A : Select one outcome that captures the essence of your strategy (e.g., NRR for SaaS, Gross Profit for retail). It should be stable, comparable over time, and meaningful to leadership.
Q : How does a KPI tree differ from a metric tree?
A : Metric trees model math between metrics; KPI trees center on strategic outcomes and chosen indicators. Use both together: metric math underpins the narrative of your KPI tree.
Q : How do KPIs relate to OKRs?
A : OKRs drive change; KPIs monitor performance. A KPI tree organizes KPIs while OKRs target specific branches for step-change improvements.
Q : How can I prevent vanity metrics in a KPI tree?
A : Favor rate/ratio metrics with causal ties to outcomes (e.g., activation %, churn %, ARPA). Audit the tree quarterly and remove signals that don’t inform decisions.
Q : How often should I update my KPI tree?
A : Review monthly for progress; refresh assumptions and structure quarterly, especially after experiments or market shifts.
Q : How do I assign ownership in a KPI tree?
A : Assign each leaf KPI to a team, define the source of truth (BI table/dashboard), and set an update cadence. Publish owners in your analytics wiki.
Q : How can a KPI tree support Balanced Scorecard?
A : Use the Balanced Scorecard perspectives to group branches, then decompose each into a KPI tree for cause-and-effect clarity.
Q : How do I build a KPI tree for a startup with limited data?
A : Start with a lightweight tree (3 drivers, 5–7 leaves). Use leading indicators you can measure now; validate drivers with scrappy experiments and adapt quickly.