
Observability Logs vs Metrics vs Traces Guide
Observability Logs vs Metrics vs Traces Guide

Observability Logs vs Metrics vs Traces Guide
Logs record detailed events, metrics show numeric trends over time, and traces map how a request moves across services. That is the simplest way to understand observability logs vs metrics vs traces—and it is also why modern engineering teams rarely rely on just one of them. Open Telemetry defines these as core telemetry signals, and OTLP is now stable for traces, metrics, and logs, which has made multi-signal observability much easier to standardize across tools and environments.
For teams running SaaS platforms, APIs, Kubernetes workloads, or mobile backends across the US, UK, and EU, the question is not which signal is “best” in the abstract. The real question is: which signal helps you detect problems faster, investigate them with less noise, and stay within your compliance and cost limits?
What Observability Logs vs Metrics vs Traces Really Mean
Logs: detailed event records
Logs are timestamped records of what happened at a specific moment. They capture exceptions, authentication failures, configuration changes, request details, and application events. In production, structured logs are usually the better choice because they are easier to parse, search, and correlate with other signals at scale.
Metrics: numeric trends over time
Metrics are numeric measurements aggregated over time. Think request rate, CPU usage, memory pressure, latency percentiles, or error rate. They are lightweight, fast to query, and ideal for dashboards, SLOs, and alerting.
Traces: the journey of a single request
Traces show how one request or transaction moves through your system. In a distributed environment, a trace can reveal that a checkout request touched an API gateway, auth service, payment processor, queue, and database before it slowed down or failed. Open Telemetry’s traces model is built for that end-to-end view across services and infrastructure.
The Core Difference in One Practical View
The easiest way to separate observability logs vs metrics vs traces is this:
Metrics tell you that something changed.
Traces show where the request path broke or slowed down.
Logs confirm the exact event, error, or payload context behind it.
A spike in 5xx responses may first appear in a metric panel. A trace may then show the slowdown inside an auth dependency. A correlated log may finally reveal the root issue, such as an expired token, timeout, or schema mismatch.
That is why strong platform and SRE teams use all three together instead of treating them as competing options.
When to Use Logs, Metrics, or Traces
Use metrics for fast alerting and reliability views
Metrics are usually the first signal to implement well because they are efficient and easy to evaluate continuously. They are the backbone of.
SRE dashboards
Latency and saturation alerts
SLO and error-budget tracking
Regional health views
Executive reliability reporting
If latency rises in New York, error rate spikes in London, or traffic drops in Frankfurt, metrics usually surface the issue first.
Use logs for debugging, audits, and evidence
Logs are the best choice when you need exact detail. They help answer questions like:
What exception was thrown?
Which user action triggered the failure?
What request field caused validation to fail?
Who accessed a sensitive workflow and when?
This matters even more in regulated environments. HIPAA’s Security Rule requires audit controls to record and examine activity in systems that contain or use ePHI, while UK GDPR guidance emphasizes data minimization and retaining only what is necessary.
Use traces for microservices and latency analysis
Traces are most valuable when a single user action crosses service boundaries. In microservices, event-driven systems, and Kubernetes environments, traces help isolate.
Cross-service bottlenecks
Slow downstream dependencies
Partial failures hidden by averages
Request fan-out problems
Tenant-specific performance issues
Averages can lie. Traces often expose the one broken path that a dashboard summary misses.
How Logs, Metrics, and Traces Work Together in Real Incidents
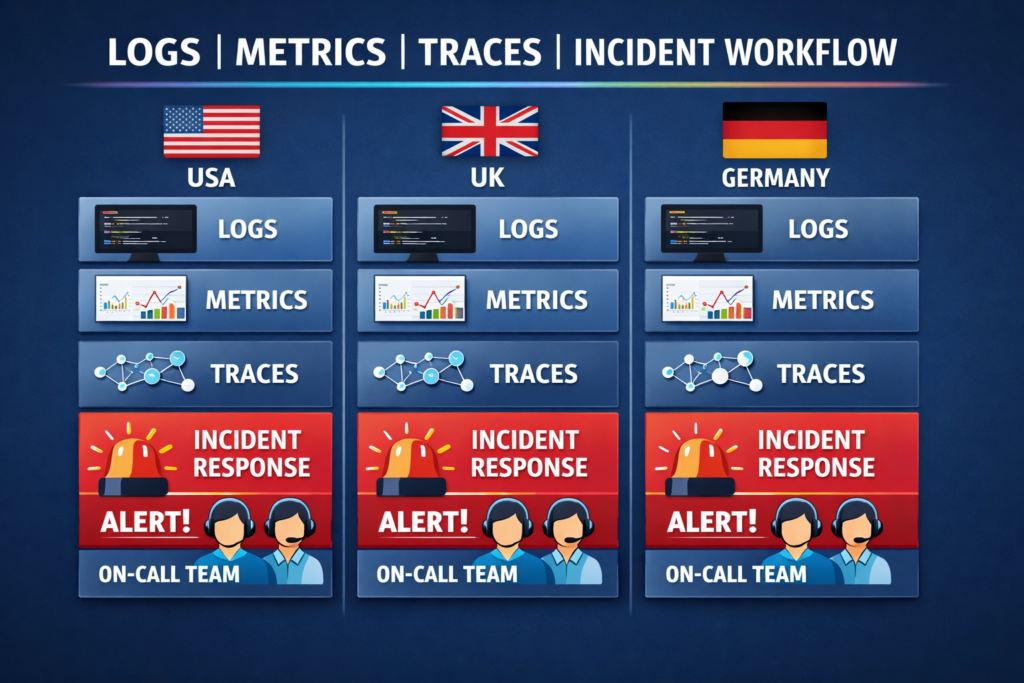
A healthy incident workflow usually starts with metrics, moves to traces, and ends with logs.
Imagine a platform team supporting customers in the US, UK, and Germany. A p95 latency metric rises. That points to a real problem, but not the cause. The team opens a trace and sees the slowdown concentrated in a payment service call. They then inspect logs and find the exact trigger: a third-party timeout, malformed response, or expired credential.
That sequence is faster than starting with full-text log search every time.
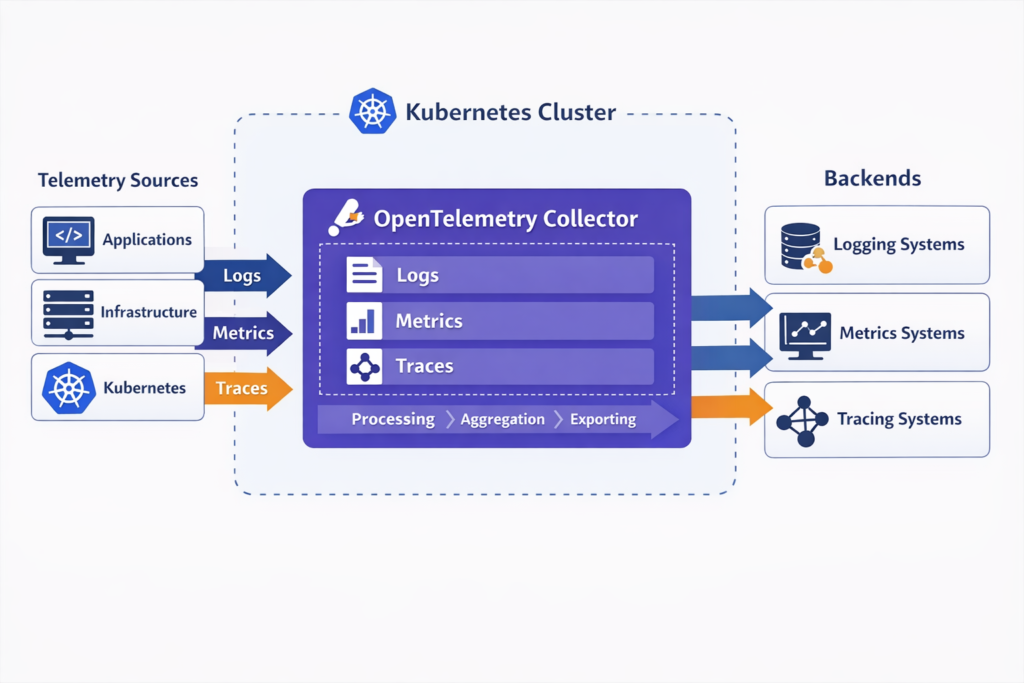
This kind of correlation matters even more in cloud-native systems because infrastructure shifts constantly. Pods restart, workloads autoscale, and traffic paths change. OpenTelemetry’s model and Collector pipeline are designed to receive, process, enrich, and export telemetry in a uniform way, which makes correlation much easier across dynamic environments.
Why Modern Teams Use All Three Together
The old “pick one” mindset does not hold up well in modern architectures. OpenTelemetry now describes itself as a vendor-neutral framework for traces, metrics, and logs, and it is supported by more than 90 observability vendors. CNCF also reported that Kubernetes production usage reached 82% among container users in its 2025 annual survey, which shows how mainstream distributed, cloud-native systems have become.
At the same time, observability stacks have become messy. Grafana’s 2024 survey found that 70% of teams use four or more observability technologies, and 79% of organizations with centralized observability said it saved them time or money.
In practice, that means the winning strategy is usually not “more tools.” It is better signal design, cleaner correlation, and more disciplined retention.
Observability Alerting Best Practices
Why metrics still lead alerting
Metrics still power most alerting because they are cheap to evaluate and naturally fit thresholds, anomaly detection, and burn-rate checks. You can run them continuously without paying the same cost you would pay to inspect every raw log line or trace span.
Where logs and traces add value
Logs and traces usually shine after the alert fires. They add the context metrics cannot provide on their own:
Logs give exact evidence
Traces narrow the blast radius
Metrics keep the signal fast and scalable
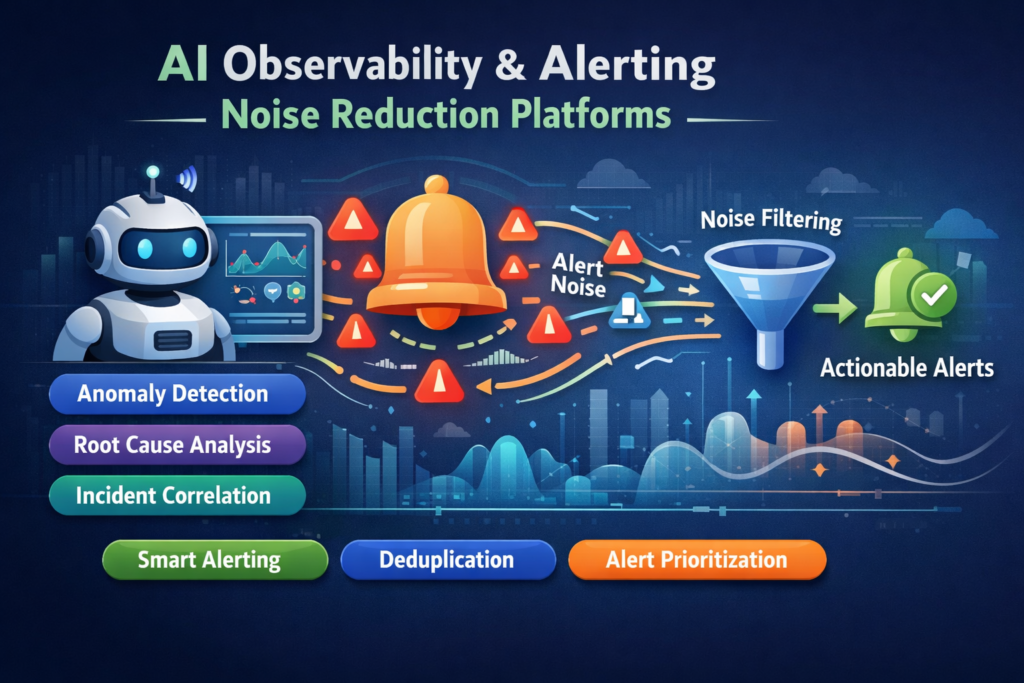
Reducing alert noise with better correlation
Alert fatigue usually comes from disconnected signals, weak ownership boundaries, and noisy thresholds. Better observability design means.
Alerting on metrics that map to user impact
Linking alerts directly to traces and logs
Using structured logging
Keeping service names and environment labels consistent
Sampling traces intelligently instead of retaining everything
Many teams also use AI-assisted grouping and anomaly detection, but those features work best when the telemetry underneath is already clean.
Open Telemetry Implementation Patterns
For most teams, Open Telemetry is now the default starting point for portable instrumentation. It supports traces, metrics, and logs through a common framework, while OTLP provides the transport layer between applications, collectors, and backends.
A practical pattern looks like this.
Instrument services with Open Telemetry SDKs or auto-instrumentation.
Send telemetry through Open Telemetry Collectors.
Enrich and scrub data in the pipeline.
Export to one or more backends.
Correlate signals with shared resource attributes and trace context.
For Kubernetes, teams often run collectors as agents and gateways. In hybrid cloud or EU-sensitive environments, they may use regional collectors and storage to keep control over residency, retention, and access.
Compliance and Data Governance in the US, UK, and Germany
Telemetry design is not just a technical decision. It is also a governance decision.
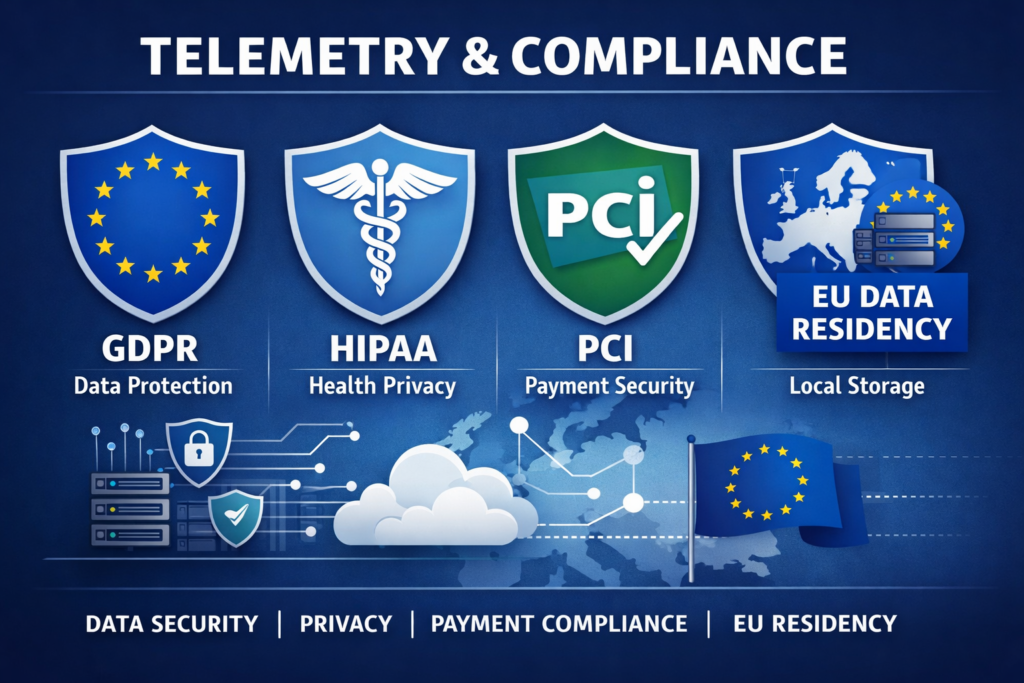
Logs usually carry the highest compliance risk because they may capture emails, IP addresses, user IDs, request bodies, or session details by accident. UK GDPR guidance stresses data minimization and storage limitation. HIPAA requires audit controls for systems using ePHI. PCI DSS also places clear emphasis on protecting payment environments and reviewing security logs.
For Germany and broader EU operations, regional handling can be a real design requirement. AWS’s privacy architecture guidance gives a Germany example in which data is aggregated in the eu-central-1 Region so that data collected in Germany does not leave German borders.
In practice, privacy-aware observability usually means.
Structured logging instead of dumping raw payloads
Field-level redaction
Shorter retention for sensitive data
Role-based access controls
Regional storage where needed
Correlation IDs instead of personal data wherever possible
How to Evaluate Observability Tools
When comparing platforms, focus less on vendor hype and more on workflow quality.
Look for:
Native correlation across logs, metrics, and traces
Strong Open Telemetry and OTLP support
Fast querying at production scale
Kubernetes and service dependency visibility
Role-based access and retention controls
Clear pricing for volume, cardinality, and storage
Regional hosting or self-hosted options where compliance matters
A US SaaS company may prefer managed speed. A London fintech may care more about governance. A Berlin-based platform team may want stronger EU residency controls. All three can be reasonable decisions.
Before you commit, test one real incident path end to end. A polished demo dashboard is not enough.
Outlook
Observability works best when logs, metrics, and traces are used together, not treated as separate choices. Metrics help teams spot issues early, traces show where requests slow down or fail, and logs provide the exact context needed to confirm the cause. For modern SaaS, cloud-native, and distributed systems, this three-signal approach improves alert quality, speeds up troubleshooting, and gives engineering teams clearer visibility into platform health.
As systems grow more complex, the value of strong telemetry design keeps increasing. Open Telemetry makes it easier to standardize collection across environments, while smart retention, correlation, and governance decisions help control cost and compliance risk. Teams that build observability around practical workflows not just dashboards are in a better position to reduce noise, resolve incidents faster, and support reliable growth.( Click Here’s )
Key Takeaways
Observability logs vs metrics vs traces is not a debate about which signal wins. Each one answers a different question.
Metrics are best for fast detection, alerting, and trend monitoring.
Traces are best for following request flow and isolating bottlenecks.
Logs are best for exact evidence, debugging depth, and audits.
The strongest observability programs combine all three, standardize collection with OpenTelemetry, and design telemetry with cost and compliance in mind from day one.
If your team is planning an observability upgrade, start by improving correlation before adding more tools. That usually delivers better incident response and less alert noise much faster.
FAQs
Q : Which signal should a small SRE team implement first?
A : Start with metrics, then add structured logs, then traces. Metrics provide the fastest operational value because they support alerting, dashboards, and SLOs with lower complexity.
Q : Are traces worth it for low-volume apps?
A : Usually yes, especially when requests cross several services or third-party APIs. You may not need full retention, but even sampled traces can make debugging much faster.
Q : Which signal is usually the most expensive?
A : Logs and traces often become more expensive than metrics because of event volume, indexing, retention, and cardinality. Good filtering and sampling make a big difference.
Q : Can Open Telemetry replace vendor-specific agents?
A : Sometimes, but not always. Many teams use an OpenTelemetry-first approach, then add vendor-specific features only where they provide clear operational value.
Q : How can EU teams stay compliant without losing debugging detail?
A : Use structured logs, redaction, regional storage, retention controls, and shared correlation IDs. The goal is to preserve useful context without collecting personal data by default.