
AI Observability Guide for Enterprise AI
AI observability helps production teams understand how AI systems behave once real users, live data and business risk are involved. It tracks models, prompts, retrieval quality, cost, latency, output quality and incidents so teams can fix problems before they damage customer trust.
For teams running AI apps, agents, copilots or RAG systems, AI observability is no longer a nice-to-have. It gives engineering, product, data and compliance teams a shared view of what happened, why it happened and what needs to improve.
McKinsey’s March 2025 State of AI survey reported that 78% of respondents said their organizations used AI in at least one business function. Gartner also predicted that at least 30% of generative AI projects would be abandoned after proof of concept by the end of 2025 because of poor data quality, weak risk controls, rising costs or unclear business value.
What Is AI Observability?
AI observability is the practice of tracing, evaluating and improving AI behavior in production systems.
It helps teams see.
What the user asked
Which prompt, model and version were used
What context or documents were retrieved
How much the request cost
How long each step took
Whether the output met quality, safety and compliance expectations
For teams building with Mak It Solutions web development services, AI observability connects application telemetry with model-level signals. Product teams can debug user-facing AI features, while engineering teams can isolate issues across APIs, prompts, data pipelines and cloud infrastructure.
AI Observability vs AI Monitoring
AI monitoring usually tracks known metrics such as latency, token usage, error rates, accuracy scores and service availability.
AI observability goes deeper. It helps teams investigate unknown problems, such as a sudden rise in hallucinations, a RAG pipeline retrieving outdated documents or a prompt regression after a release.
Monitoring tells you something is wrong. Observability helps you understand why.
Why Traditional APM Is Not Enough for AI Systems
Traditional APM tools are useful for software health, but AI systems can fail even when infrastructure looks fine.
A chatbot might return a valid response that is still factually wrong, non-compliant, biased or too expensive to serve. A support assistant might answer quickly but use outdated product information. A fraud model might keep running while its accuracy quietly drops.
That is why teams using AWS, Azure, Google Cloud, Datadog, New Relic, OpenTelemetry or SIEM workflows need AI-specific telemetry layered on top.
Model calls, embeddings, retrieved chunks, prompt versions, evaluation scores and user feedback all need to be visible.
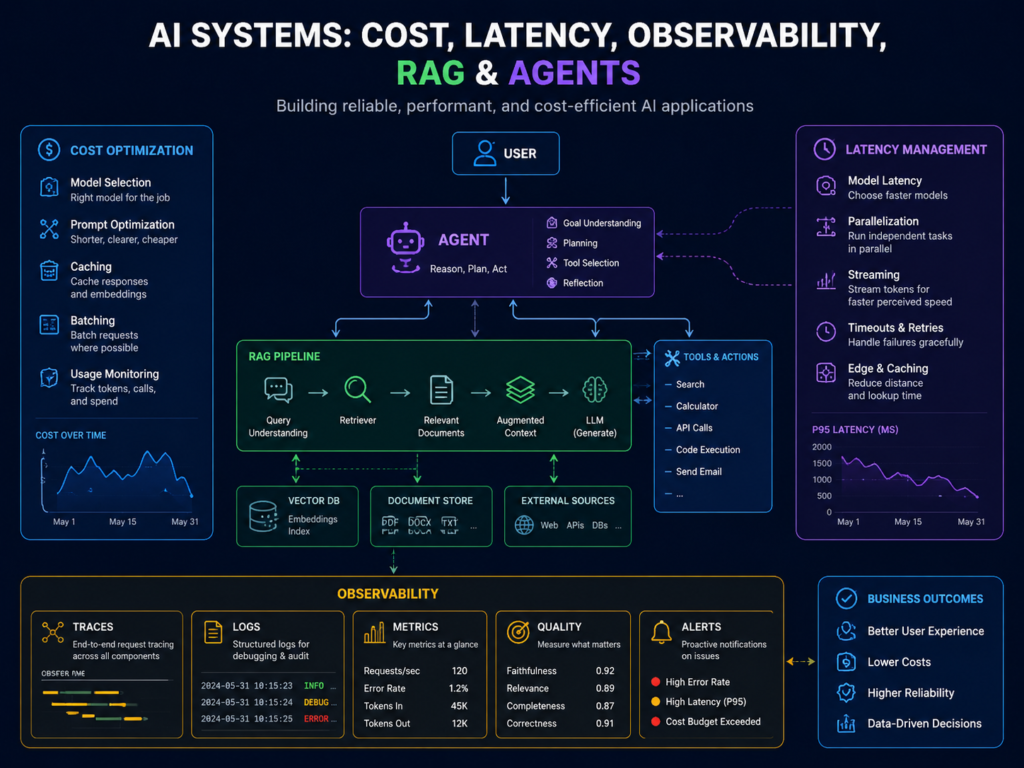
Core AI Observability Metrics to Track
The most important AI observability metrics are quality, accuracy, drift, latency, cost, retrieval performance, safety and user feedback.
These metrics show whether an AI system is useful, reliable and financially sustainable in real production conditions.
Model Performance, Accuracy and Quality Signals
Start with business-facing quality signals.
Answer correctness
Task completion rate
Escalation rate
Human override rate
Customer satisfaction
Evaluation score
Segment-level performance
For classification or prediction models, track precision, recall, false positives and false negatives.
For LLM apps, quality often depends on evaluations. Use golden datasets, human review, automated graders and domain-specific rubrics. Teams working on analytics-heavy systems can also connect AI quality with KPIs through business intelligence services.
LLM Tracing, Prompt Regression and Hallucination Monitoring
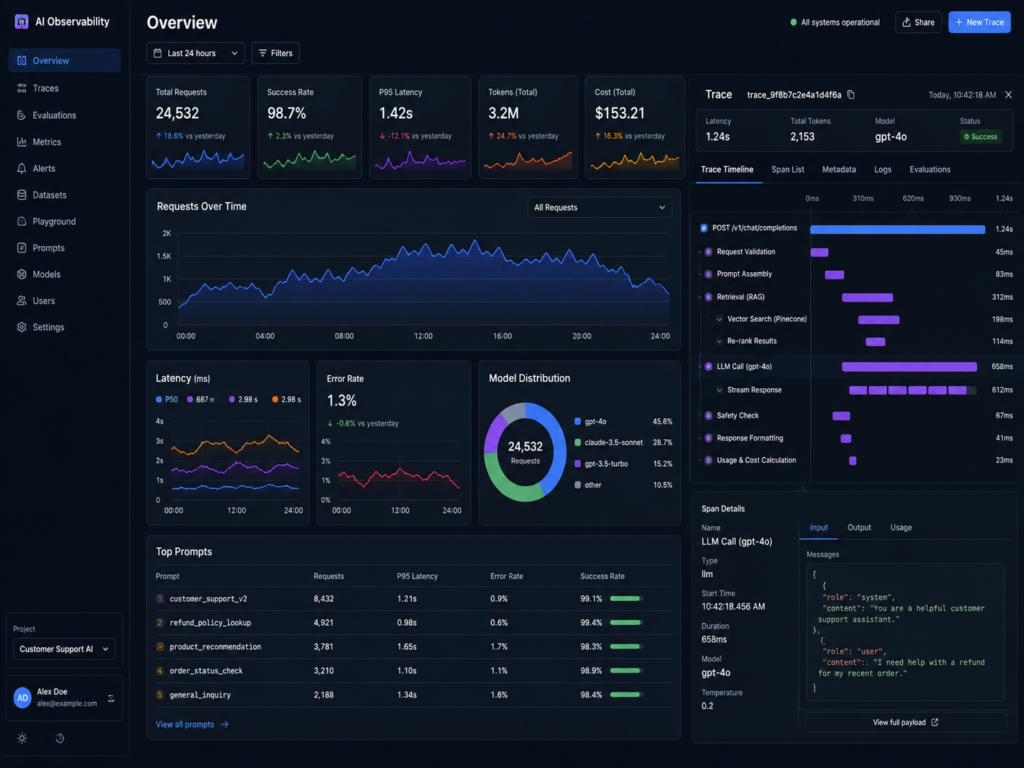
LLM tracing records each step in an interaction: user input, system prompt, model version, retrieved context, tool calls, output and evaluation result.
This is critical for prompt regression detection. A prompt that worked last week may fail after a model upgrade, content update or policy change.
Hallucination monitoring should flag.
Unsupported claims
Missing citations
Contradictory answers
Unsafe recommendations
Responses outside approved policy
In practice, the best teams treat LLM outputs as inspectable workflows, not black-box magic.
RAG Evaluation, Retrieval Quality and User Feedback
RAG systems need observability at both retrieval and generation layers.
Track retrieval precision, chunk relevance, source freshness, missing-document rates, citation quality and user feedback. A legal AI assistant in London or a healthcare workflow near Manchester may fail not because the LLM is weak, but because the retrieval layer surfaced outdated policy documents.
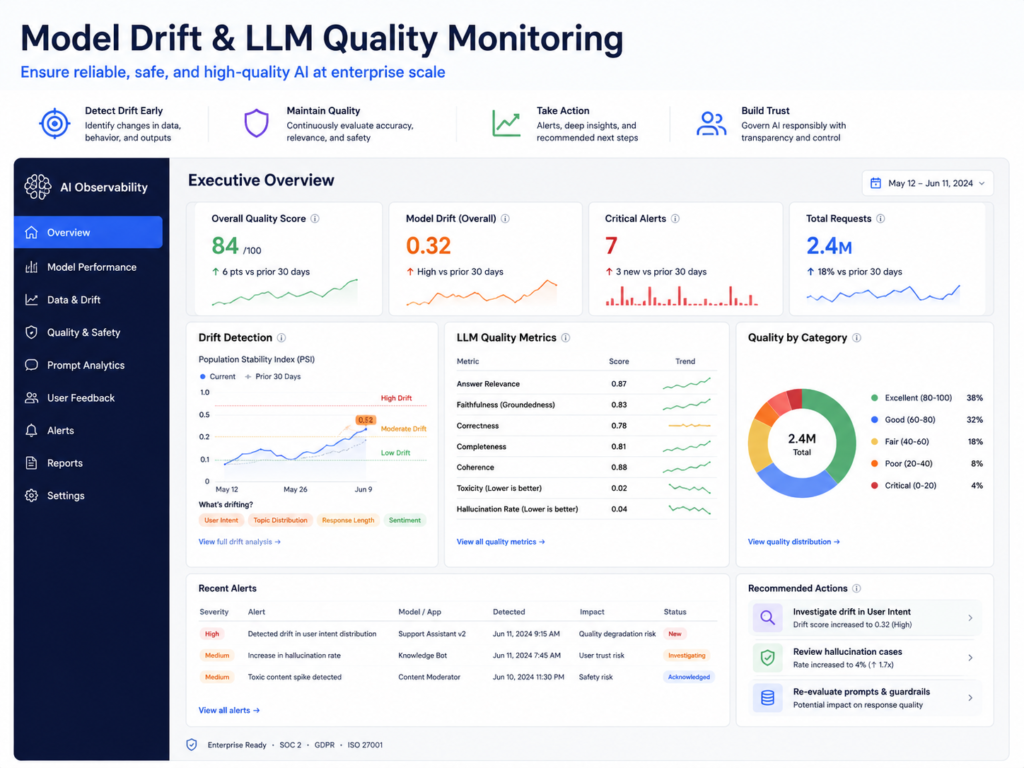
Model Drift, LLM Drift and Quality Monitoring
Model drift happens when production data, user behavior or real-world conditions change after deployment.
LLM drift can also appear when model providers update behavior, prompts change, knowledge sources become stale or users start asking new types of questions.
What Causes Model Drift in Production AI?
Drift is caused by changes in data, users, markets, products, regulations or infrastructure.
A fraud model trained on last year’s behavior may miss new attack patterns. A customer support bot trained on old product documentation may give outdated answers after a feature launch.
In SaaS teams, drift can also come from geography. Users in Austin, New York, London, Berlin and Munich may ask different questions, use different terminology and trigger different compliance needs.
How to Detect LLM Drift and Unsafe Outputs
Detect drift by comparing live outputs against baselines.
Track evaluation scores by.
Model version
Region
User segment
Prompt version
Data source
Product feature
Traffic type
Watch for rising refusal rates, unsupported answers, slower responses, higher token consumption and increased human escalations.
For high-risk workflows, combine automated checks with human review. This fits well with NIST AI RMF guidance around trustworthy AI risk management.
The practical fix is not one dashboard. It is a feedback system: evaluate outputs, compare performance over time, route risky cases to humans and update prompts, models or retrieval pipelines when quality drops.
Cost, Latency and Performance Observability
To monitor LLM cost, quality, latency and drift, teams should track token usage, provider spend, model versions, request duration, retrieval steps, cache hit rates, evaluation scores and incident trends in one workflow.
This makes AI performance measurable instead of anecdotal.
LLM Cost Monitoring.
LLM cost monitoring should show spend by model, provider, product, customer, team, feature and environment.
Token usage often grows quietly until finance sees the bill. Track input tokens, output tokens, retries, failed calls, embedding cost, vector database cost and agent tool calls.
Gartner predicted in May 2026 that 40% of organizations deploying AI will use dedicated AI observability tools by 2028 to monitor model performance, bias and outputs.
Latency Monitoring for AI Apps, Agents and RAG Pipelines
AI latency is rarely one number.
A single response may include authentication, retrieval, reranking, model generation, tool calls, guardrails and post-processing.
For AI apps built with Node.js development services or mobile interfaces through mobile app development services, observability should show which step is slowing things down.
A slow vector search needs a different fix than a slow model endpoint.
AI Cost Observability for SaaS, Fintech and Enterprise Teams
SaaS, fintech and enterprise teams need cost controls before scaling.
Set budgets, rate limits, alerts and customer-level profitability views. For fintech products, AI cost observability should sit alongside PCI DSS security controls and audit workflows.
PCI DSS provides technical and operational requirements designed to protect payment account data.
AI Incident Management and Production Reliability
AI observability reduces incidents by connecting telemetry, traces, evaluations and alerts to production outcomes.
Instead of treating bad AI outputs as mysterious one-off events, teams can diagnose root causes and build repeatable reliability workflows.
AI Failure Detection, Alerting and Escalation
AI failure detection should alert on.
Quality drops
Unsafe outputs
Cost spikes
Latency breaches
Retrieval failures
Abnormal traffic
Evaluation score drops
Unexpected model behavior
Alerts should route to the right owner. Engineering handles infrastructure. Data teams handle retrieval issues. Product owners handle UX problems. Compliance teams review risk events.
Root-Cause Analysis for AI Failures
Root-cause analysis starts with traces.
Ask practical questions.
Was the wrong document retrieved?
Did the prompt change?
Did the model provider update behavior?
Did a tool call fail?
Did the user ask something outside policy?
Did the system miss an escalation trigger?
Tools such as LangSmith, Langfuse, Arize Phoenix, MLflow and OpenTelemetry can support this workflow when integrated with MLOps and incident platforms.
The goal is not just fewer outages. It is safer AI behavior, faster debugging and clearer accountability when AI affects customers, money, health, security or compliance.
AI Observability for USA, UK, Germany and EU Teams
AI observability helps regional teams prove that AI systems are monitored, governed and improved over time.
For US, UK, Germany and EU organizations, it supports auditability, data protection, incident response and vendor accountability.
USA.
In the USA, healthcare teams must consider HIPAA when AI systems touch electronic protected health information.
For SaaS teams in New York, Seattle or Austin, SOC 2, PCI DSS and customer security reviews often require logs, access controls, incident history and vendor risk evidence. AI observability helps provide that evidence.
UK.
In the UK, AI systems used around NHS workflows, FCA-regulated financial services, Open Banking or PSD2-style data flows need strong audit trails.
A London fintech chatbot, for example, should log retrieval sources, consent boundaries, escalation triggers and model outputs when customer-impacting advice is involved.
Germany/EU.
Germany and EU teams must consider GDPR/DSGVO, BaFin expectations, SEPA payment contexts, data residency and the EU AI Act.
The EU AI Act was published as Regulation (EU) 2024/1689, laying down harmonised rules on artificial intelligence.
For teams in Berlin, Munich, Frankfurt, Paris, Amsterdam or Dublin, AI observability should support regional hosting choices, access control, retention policies and audit logs across AWS, Azure or Google Cloud regions.
How to Choose an AI Observability Platform
Choose an AI observability platform by evaluating integrations, trace depth, evaluation workflows, security, deployment options, audit logs, cost analytics and support for your AI stack.
The right platform should fit engineering workflows and compliance requirements.
Open-Source vs Enterprise AI Observability Tools
Open-source tools can be cost-effective and flexible for early teams.
Enterprise platforms are often better when you need role-based access, audit trails, compliance reporting, SSO, support, retention policies and self-hosting.
A practical approach is to start with open standards, then add enterprise controls as risk grows.
Integration with APM, SIEM, MLOps and Incident Workflows
A strong platform should connect with APM, SIEM, MLOps, data pipelines and incident tools.
It should not become another isolated dashboard.
Teams building customer-facing platforms with React development services, Python development services or Laravel development services should plan observability during architecture, not after launch.
Vendor Checklist for AI Observability
Before choosing a vendor, ask about.
Encryption
SSO
RBAC
Audit logs
Retention controls
PII redaction
Self-hosting
Data residency
Evaluation templates
Model-provider coverage
Export options
Gartner also predicted in March 2026 that explainable AI would drive LLM observability investments to 50% for secure GenAI deployment by 2028.
That makes vendor flexibility important. Today’s model stack may not be tomorrow’s.
Concluding Remarks
AI observability is the difference between launching AI and safely operating it in production.
It helps teams trace model behavior, control cost, detect drift, improve quality, support compliance and respond faster when something goes wrong.
Planning to launch or stabilize a production AI system? Mak It Solutions can help your team design AI observability across prompts, RAG pipelines, data workflows, dashboards and compliance controls.
Book a scoped consultation with Mak It Solutions to map your AI risks, define the right metrics and build a practical observability roadmap for US, UK, Germany or EU deployment.( Click Here’s )
Key Takeaways
AI observability gives production teams visibility into models, prompts, data, retrieval, cost, latency and incidents.
Traditional APM is not enough because AI systems can fail while infrastructure metrics still look healthy.
US, UK, Germany and EU teams should design observability around HIPAA, PCI DSS, SOC 2, UK-GDPR, GDPR/DSGVO, BaFin and EU AI Act needs.
Strong platforms integrate with APM, SIEM, MLOps, evaluation pipelines and incident workflows.
FAQs
Q : What is the difference between LLM observability and AI observability?
A : LLM observability focuses on large language model systems, including prompts, token usage, hallucinations, model versions, retrieval quality and tool calls. AI observability is broader. It includes LLMs, traditional machine learning models, computer vision, recommendation engines, AI agents and production data pipelines.
Q : Which AI observability metrics matter most for enterprise teams?
A : The most important metrics are output quality, accuracy, hallucination rate, retrieval relevance, latency, cost, drift, safety flags, escalation rate and user feedback. Enterprise teams should also track audit logs, access patterns, model versions, prompt versions and data-source freshness.
Q : How can teams monitor hallucinations in production LLM apps?
A : Teams can monitor hallucinations by combining automated evaluations, source-grounding checks, human review and user feedback. Unsupported claims, missing citations, contradictory answers and risky advice should trigger review or escalation.
Q : Do AI observability platforms help with GDPR and SOC 2 compliance?
A : AI observability platforms can support GDPR and SOC 2 readiness, but they do not guarantee compliance by themselves. They help create audit trails, access logs, incident records, data-flow visibility, retention controls and evidence of ongoing monitoring.
Q : When should a company move from AI monitoring to AI observability?
A : A company should move from basic AI monitoring to AI observability when AI starts affecting customers, revenue, regulated decisions or operational workflows. Production AI needs traces, evaluations, drift detection, cost analytics and incident workflows.