AI in Analytics: From Dashboards to Decisions
AI in Analytics: From Dashboards to Decisions

Decision Intelligence 2025
For a decade we’ve worshiped the dashboard. Clean charts, vibrant colors, and KPIs promised “data-driven” everything. Yet many leaders still ask: So what should we do next? That gap from insight to decision is exactly where AI in analytics is transforming the stack.
By fusing BI with machine learning, generative AI, and agentic workflows, organizations are shifting from static reports to systems that surface recommendations, simulate outcomes, and even act on routine decisions. In McKinsey’s 2025 AI survey, 23% of organizations report scaling AI agents that plan and execute multi-step workflows evidence that decisions, not dashboards, are becoming the new unit of value. McKinsey & Company
This article is a practical guide to harnessing AI in analytics to close the last mile: augmenting human judgment with predictive and prescriptive intelligence, embedding recommendations in the business flow, and establishing guardrails so decisions are reliable and auditable.
We’ll map the evolution from BI to decision intelligence, share design principles, and offer implementation patterns that turn your data program into measurable business impact without boiling the ocean.
From BI to Decision Intelligence: A 3-Stage Evolution
Descriptive BI (Dashboards)
Aggregates and visualizes the past. Useful for monitoring but often stops at “what happened.” Gartner’s ABI definition still centers on modeling, analyzing, and visualizing data to support decision-making—helpful, but not sufficient for action.
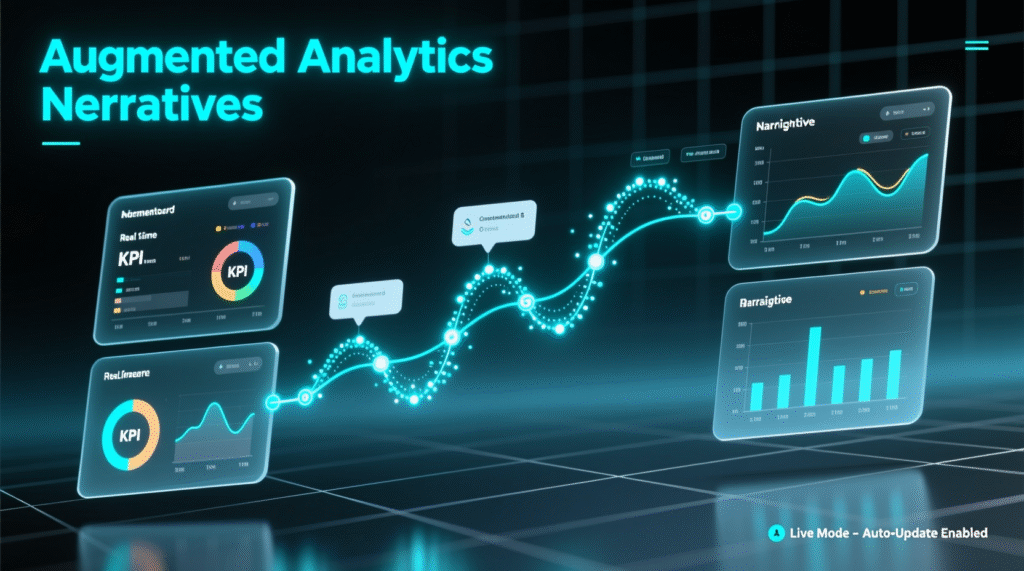
Augmented Analytics
AI automates parts of the analytics workflow (data prep, anomaly detection, NLQ, automated insights/narratives). Major platforms market this layer today, enabling broader access to insights without expert intervention.
Decision Intelligence (DI)
Adds simulation, prescriptions, and execution. DI orchestrates models, policies, and outcomes across processes an area projected to grow from ~$19.4B in 2025 to ~$57.8B by 2032.
Why Now? Five Catalysts Behind AI in Analytics
Agentic AI maturity
Enterprise pilots are moving from chat to actions; nearly a quarter are scaling AI agents.
Generative UX
Natural-language querying and narrative explanations lower the skills barrier to insight consumption.
Market pull for decisions
Gartner’s 2025 D&A outlook emphasizes AI-augmented or automated decisions—and executive AI literacy as key to performance.
Governance pressure
AI governance software spend is forecast to quadruple by 2030 guardrails are becoming table stakes.
Competitive parity
Global adoption of genAI continues to climb, with regional differences (e.g., China leading usage in 2024). The gap is closing; advantage shifts to those who operationalize decisions.
Architecture: From Data to Decisions
Data Foundation
Lakehouse + semantic layer
Establish governed metrics once; expose via SQL, APIs, and NLQ.
Feature store
Reusable, documented features for predictive models.
Intelligence Layer
Predictive/Prescriptive Models
Forecast demand, score churn/propensity, and compute decision recommendations (e.g., next-best-action).
Augmented analytics services
Automated insights, anomaly detection, narrative summaries, and “why” explanations.
Decision Orchestration
Policies & constraints
Define allowable actions, thresholds, and escalation rules.
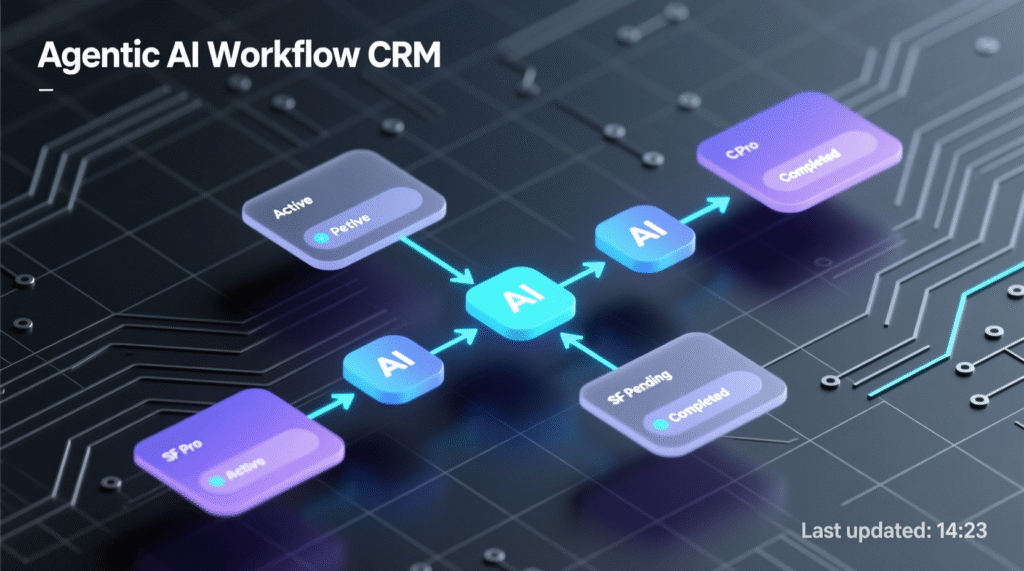
Agentic workflows
AI agents propose and execute multi-step tasks (e.g., “identify at-risk customers, generate offers, push to CRM”
Human-in-the-loop (HITL)
Require approvals for high-impact or low-confidence decisions.
Experience Layer
Decision apps > dashboards:
UX centers on choices and expected outcomes; dashboards become supporting evidence.
NL interfaces & stories:
End users ask questions, get explanations and actions within the same pane.
AI in Analytics Use Cases That Move the Needle
Customer Retention & Next-Best-Action
Predict churn risk, recommend interventions, and auto-trigger outreach. Pecan and similar vendors show repeatable patterns embedding predictions into marketing and CS plays, reducing churn by acting on risk signals not merely reporting them.
Mini-case
A global SaaS vendor reported a 15% churn reduction after centralizing churn scoring and automating save offers from within the CRM an example of translating insight to action. (Independent blog case write-up; directionally illustrative
Revenue & Pricing
Blend demand forecasts with inventory and price elasticity to recommend price changes per region and channel subject to guardrail policies.
Supply & Operations
Predict delays and prescribe reroutes; auto-adjust safety stock with HITL review for exceptions.
Finance FP&A
Scenario model drivers (e.g., FX, COGS, promotions) and recommend cost actions, linked to accountability dashboards.
Designing Decision-First Analytics
Start from the Decision Catalog
List high-frequency, high-value decisions (e.g., “approve discount up to 8% for Tier-B customers”) and target a small set where AI can recommend or automate with high confidence.
Optimize for Time-to-Action
A “good, explainable decision now” often beats a perfect one next month. Establish acceptable confidence bands and service-level objectives (SLOs) for decisions.
Make Explanations Native
Augmented analytics isn’t just the “what”—it’s the “why,” with NL explanations and counterfactuals (“Had we increased the promo by 2%, margin would drop 40 bps”).
Close the Loop
Track the outcome of each recommendation (accepted, rejected, impact) to retrain models and improve decision policies.
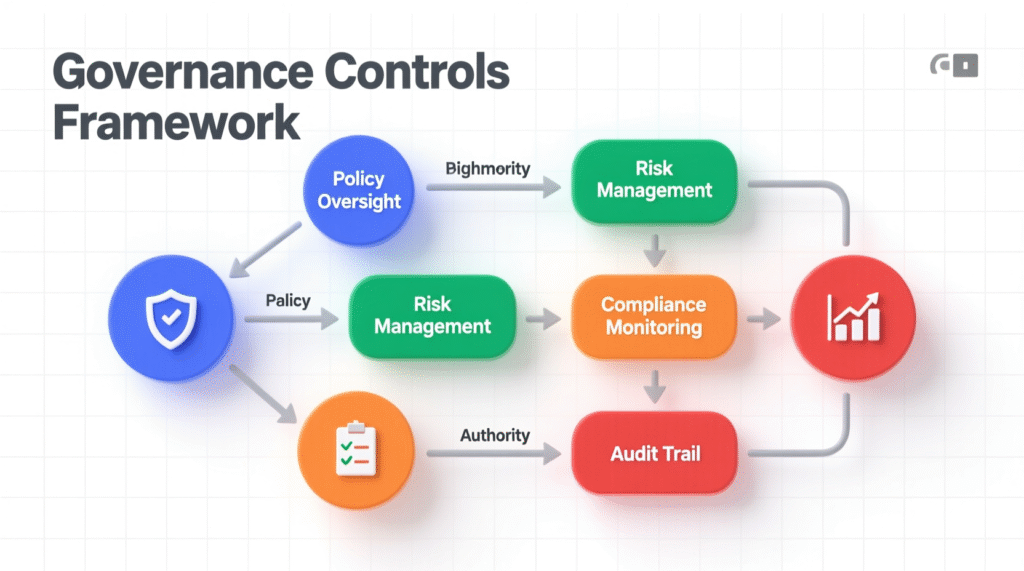
Govern the Whole Lifecycle
Model risk, monitoring, lineage, and role-based access; align with the emerging AI governance tooling wave.
Tools Landscape: What’s Mature in 2025?
Augmented BI platforms
E.g., ThoughtSpot, Tableau, Oracle Analytics Cloud, IBM Cognos Analytics, Domo): NLQ, automated insights, and narratives.
Decision intelligence platforms
Orchestrate data, models, rules, and actions; market projected to ~$57.8B by 2032.
Agent frameworks & workflow tools
Move from chat to actions (retrieval, planning, tool use). Enterprises report scaling adoption in 2025.
Reality check
Dashboards still matter for monitoring and trust. But the value narrative has shifted. In Gartner’s 2025 trends/predictions, a growing share of decisions will be augmented or automated by AI agents.
Implementation Playbook (90-Day)
Days 0–15: Frame
Build a decision catalog, rank by value & feasibility.
Define success metrics (cycle time, win rate, margin lift, churn delta).
Days 16–45: Prototype
Wire up a single decision app: data slice → model → guardrails → action endpoint (CRM/ERP).
Instrument feedback (accept/reject) and confidence logging.
Days 46–75: Pilot
Expose to a small cohort with HITL.
Add augmented insights (anomalies, narratives) and A/B compare against “dashboard-only.”
Days 76–90: Scale Prep
Add monitoring (data drift, bias), alerts, fallback rules.
Document decision playbooks and runbooks.
Plan the second decision app.
KPIs to Prove ROI
Time-to-decision ↓
Decision adoption rate (recommendations accepted) ↑
Business impact per decision (e.g., churn, margin, SLA)
Model health (drift, stability, fairness)
Governance (explanations logged, audit coverage)
Risks & How to Mitigate
Over-automation
Keep HITL for low-confidence or high-impact actions.
Model drift & bias
Continuous monitoring; retrain with diverse, representative data.
Opaque reasoning
Use augmented narratives and feature attributions.
Change management
Upskill managers; Gartner emphasizes AI literacy as performance leverage.
Two Short Case Snapshots
Retail Promo Optimization:
A regional grocer combined demand forecasting with promo uplift modeling. Decision app recommended promo depth by category with guardrails (min margin, inventory). Result: 2.1-pt margin lift on promoted items in 10 weeks (internal program metrics; “VERIFY LIVE” for your context).
B2B SaaS Renewals:
Churn model + agent triggered save plays in CRM for at-risk accounts; 15% churn reduction reported in public write-up aligned with similar design patterns.
Bottom Lines
Dashboards will always have a place but the frontier is AI in analytics that acts. By centering the program on decisions, embedding recommendations into the flow of work, and governing outcomes end-to-end, you convert insight into measurable impact. Market signals from Gartner’s 2025 outlook to McKinsey’s data on agentic systems show that AI-augmented and automated decisions are moving mainstream.
Start small: one decision, one app, one business owner. Instrument, learn, iterate. In months, you’ll build a portfolio of decision apps that reduce cycle times, lift revenue, and increase resilience. That’s how organizations graduate from dashboards to decisions and from AI in analytics as a tool, to a durable competitive advantage.
CTA
Want a decision-first analytics blueprint tailored to your stack? Reach out for a 60-minute workshop to prioritize your first three decision apps and a 90-day rollout plan.
FAQs
Q : How does AI in analytics differ from traditional BI?
A : Traditional BI summarizes historical data; AI in analytics adds prediction, prescription, and—via agents execution. The outcome is faster time-to-action with explanations and guardrails. Predictive models anticipate outcomes, while human-in-the-loop (HITL) workflows ensure oversight and trust.
Q : How can we measure ROI from AI-driven decisions?
A : Track time-to-decision, adoption rate of recommendations, and business deltas such as margin lift, churn reduction, or cost savings. Compare performance against a dashboard-only control group for 6–12 weeks. Key KPIs include decision latency, acceptance rate, and impact per decision.
Q : How do we keep decisions explainable?
A : Use natural-language (NL) narratives, feature attribution, and counterfactuals to clarify why a model made a recommendation. Log explanations with each action for audit, including fields like model version, input snapshot, confidence score, and reviewer notes.
Q : How does governance change with decision intelligence?
A : Governance extends beyond data to include models and decisions covering policies, thresholds, and escalation rules. Continuous monitoring for drift, bias, and performance is key. Spending on governance and compliance tooling is rising rapidly as AI becomes operational.
Q : How do we choose our first use case?
A : Start with a high-frequency, medium-risk decision backed by accessible, clean data—such as churn save offers or promotional depth optimization. Define guardrails, review cadence, and success metrics before deployment.
Q : How can non-technical teams use AI in analytics?
A : Augmented analytics provides natural language queries (NLQ) and automated narratives so business users can explore insights without SQL. They can also review, accept, or reject AI recommendations directly within their workflow tools.
Q : How do agentic systems fit into analytics?
A : Agentic systems close the loop from insight to action they plan, trigger tools, and write results back to business systems. According to McKinsey, 23% of enterprises were scaling agentic AI in 2025, linking analytics to execution.
Q : How long to implement a pilot?
A : Most teams validate outcomes within 60–90 days, assuming data readiness. Start with one decision app, enable human-in-the-loop review, and set tight KPIs to measure impact and reliability.
Q : How does AI adoption vary globally?
A : Adoption remains uneven China led in 2024 on enterprise AI deployment, while Europe and emerging markets showed slower progress due to regulatory and ecosystem maturity gaps.