AI Observability: Monitor Drift, Cost and Quality
AI Observability: Monitor Drift, Cost and Quality

AI Observability: Monitor Drift, Cost and Quality
AI observability is the end-to-end monitoring of AI and LLM systems data, models, prompts, agents, cost, and user outcomes so teams can detect drift, failures, security issues, and overspend before they impact customers. By combining traces, evaluations, feedback and cost telemetry in one view, AI observability helps US, UK, Germany and wider EU teams keep AI applications reliable, compliant and within budget.
Introduction
AI projects are no longer experiments. They’re powering customer support, underwriting, trading, clinical workflows, and critical back-office automation across the United States, United Kingdom, Germany and the wider European Union.
Between 2023 and 2024, generative AI adoption jumped from roughly 55% of organizations to about 75%, and investment is compounding fast. As that scale grows, so do the risks: subtle data drift, hallucinating agents, exploding token bills, and regulatory expectations from HIPAA, GDPR and the EU AI Act.
AI observability is how you keep control. It gives your team a live “flight deck” across drift, cost and user-perceived quality so you can keep AI systems safe, reliable and defensible in New York, London or Berlin at the same time.
What Is AI Observability?
AI observability is end-to-end monitoring of AI and LLM systems data, models, prompts, agents, infrastructure, cost and user outcomes designed to detect issues like drift, failures, safety violations and overspend before they hit customers. It goes beyond infrastructure health to track how your models actually behave in production, what users experience, and whether the system is operating inside your risk and budget guardrails.
AI observability vs traditional monitoring and APM
Traditional monitoring and APM focus on logs, metrics and traces from services: CPU, error rates, response times, and dependencies. They’re great at telling you “the API is slow” but not “this LLM is hallucinating on German-language claims” or “this agent is stuck in a tool-calling loop.”
LLM apps fail in ways classic monitoring can’t see: nonsensical outputs, prompt injection, retrieval mismatches, or tools invoked out of order. AI observability adds semantic traces (prompts, responses, embeddings, tool calls), model-level quality signals and guardrail violations so you can understand why a conversation, RAG answer or agent workflow went wrong not just that your latency spiked.
AI vs LLM vs agent observability (and how they relate)
AI observability umbrella term for observing data pipelines, ML models, LLMs, agents and downstream business impact.
LLM observability zooms in on prompts, completions, RAG context, safety filters, and LLM evaluation metrics.
Agent observability adds multi-step workflows, tool calls, planning failures and retries for AI agents.
AI FinOps the financial lens tracking token usage, GPU time and per-feature economics so you can optimize cost without degrading quality.
In practice, you need all three: model-level and agent-level views feeding into an AI observability framework that your SRE, data and product teams can share.
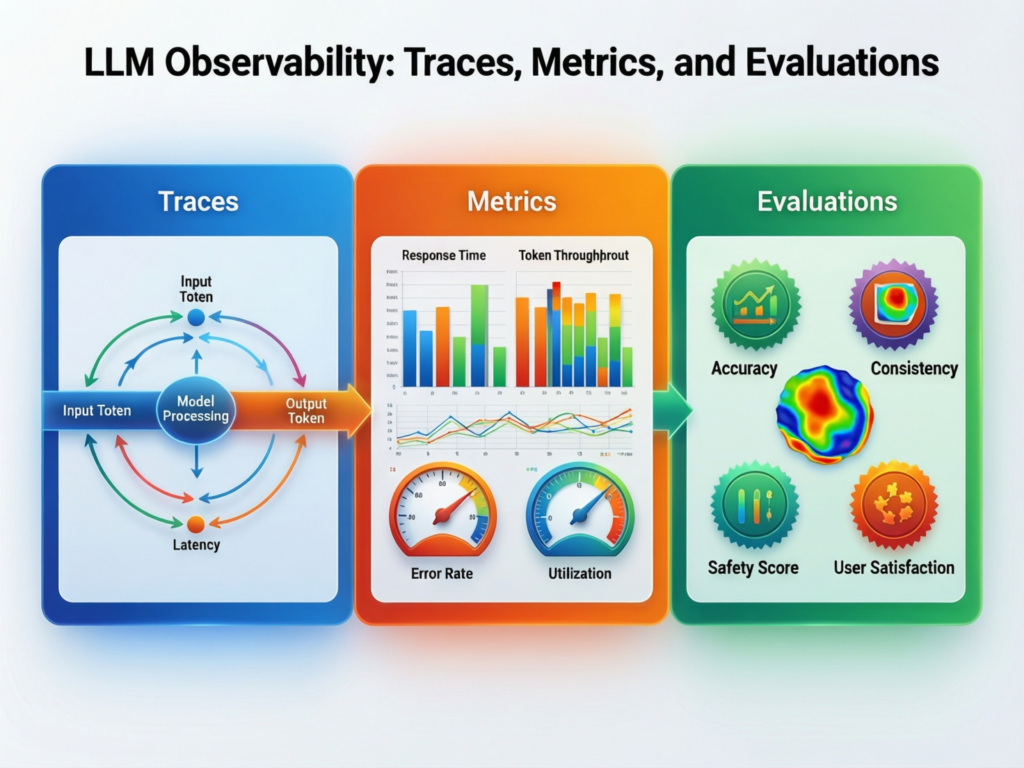
Core pillars: data, model, system, user and cost signals
A useful AI observability framework usually covers five signal pillars:
Data freshness, schema changes, PII leakage, missing values, RAG index coverage.
Model & LLM accuracy/task success, hallucination rate, safety incidents, drift vs baselines.
System latency, throughput, error codes, context window usage, timeouts.
User CSAT, thumbs up/down, task completion, escalation to human agents.
Cost tokens per request, GPU hours, per-feature margin, per-tenant spend.
Together, these give you a single lens on quality, safety, UX and economics instead of a dozen disconnected dashboards.
AI & LLM Observability Architecture
A modern AI observability stack combines classic telemetry (metrics, logs, traces), structured AI events (prompts, intermediate tool calls, RAG chunks, evals), and governance metadata (lineage, policies, approvals) into one view across the AI pipeline.
From ingestion to agents: end-to-end AI pipeline monitoring
Think of a typical enterprise pipeline from ingestion to agents:
Ingest & feature store data quality checks, schema drift, freshness SLAs.
Model / LLM serving per-model latency, error rates, safety filters, routing decisions.
Retrieval & RAG search latency, recall@k, content source, index freshness.
Agents & workflows step-by-step traces for tools and decisions.
End user chat UI, API clients, mobile and web apps.
End-to-end AI pipeline monitoring instruments each hop, then stitches it into a single trace so you can replay “what happened” for a failing claim in San Francisco or a misrouted payment in London.
Key components: tracing, evaluations, feedback loops, alerting
Tracing every request becomes a trace that includes user input, prompt templates, intermediate model calls, tools and final output. OpenTelemetry-style traces can be correlated with your existing APM stack.
Evaluations automatic evals (LLM-as-judge, test suites, golden datasets) compute metrics like task success, toxicity or grounding per run.
Feedback loops – thumbs, free-text feedback and supervisor review feed into retraining and prompt improvements.
Alerting & routing alerts fire on drift, spikes in hallucinations or cost anomalies, routing incidents to data, ML, SRE or product on-call.
Integrating AI observability with existing APM/observability stacks
You don’t have to replace your existing tools. Many platforms integrate with Datadog, Dynatrace, or cloud monitoring on Amazon Web Services (AWS), Azure and GCP. You stream AI traces and metrics into the same dashboards your SREs already watch, but augment them with quality and cost views your data and product teams need.
In many US/UK enterprises, AI observability becomes an extension of your existing incident workflow: PagerDuty/Slack channels, runbooks and postmortems, just with extra AI-specific context.
Monitoring Drift, Data Quality and Reliability
AI drift monitoring means tracking how inputs, model behavior and user outcomes change over time so you can catch silent failures like biased outputs or falling relevance before SLAs and regulatory expectations are breached.
Data drift vs concept drift in AI and LLMs
Data drift your input distribution changes. Example: a fraud model trained on US card transactions starts seeing new patterns from German neobanks; your RAG pipeline begins ingesting new policy documents but the index lags behind.
Concept drift the underlying relationship between inputs and outputs changes. For instance, fraudsters switch tactics, or user behavior shifts after a new pricing model.
For LLMs and RAG, drift might show up as more out-of-date answers, falling click-through on recommendations, or higher escalation rates in a support chatbot.
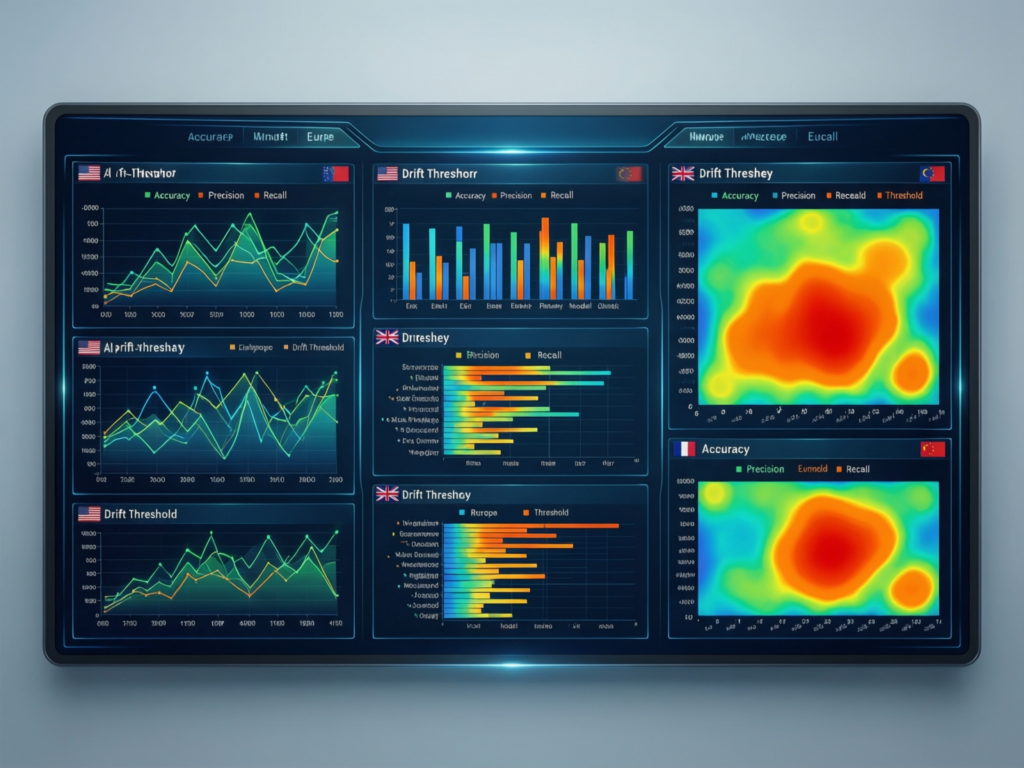
Practical drift detection techniques for production models
Common techniques include:
Statistical tests on feature distributions (e.g., PSI, KS tests) to detect input shifts.
Embedding-space drift monitor vector distances or clustering vs a baseline embedding distribution.
Label or feedback drift track acceptance rates, “thumbs down” ratios, or escalation rates over time.
Prompt-template regressions run nightly test suites against key prompts to detect regressions when you ship new templates or models.
Open-source tools like Evidently and commercial AI observability platforms increasingly ship these techniques out of the box.
Reliability patterns for LLM applications and AI agents
LLM apps tend to fail in repeatable ways:
Hallucinations and ungrounded answers
Tool-calling failures (missing parameters, wrong order, timeouts)
Routing issues (wrong model or skill for the task)
Context-window problems (truncation, missing key facts)
Reliability patterns include guardrails, fallbacks (e.g., safer models), timeouts and circuit breakers for agents. AI observability makes these visible on a dashboard instead of burying them in logs.
AI Model Quality Monitoring.
AI model quality monitoring combines automatic evaluations, human review and user feedback to track hallucination rate, task success, safety violations, latency and satisfaction scores in a single quality scorecard.
Defining “good enough” quality per use case
“Good enough” depends heavily on context.
A marketing assistant for a Berlin e-commerce brand can tolerate occasional style slips if productivity is high.
A developer copilot in a London fintech needs stricter guardrails but can still ask clarifying questions.
A clinical decision support tool integrated with the NHS or a US health system faces HIPAA, clinical safety expectations and zero tolerance for hallucinated dosages.
Your AI observability framework should encode these differences as separate scorecards and alert thresholds.
Evaluation metrics for LLMs (hallucinations, safety, task success)
Useful AI evaluation metrics for quality and safety include.
Task success pass/fail on test tasks, often using LLM-as-judge.
Grounding / hallucination rate – does the answer match retrieved documents?
Safety & policy violations toxicity, PII leakage, jailbreak attempts.
UX metrics first-contact resolution, handle time and user satisfaction.
Modern AI observability platforms combine batch offline evals with online shadow testing and can recommend new tests when they detect novel failure patterns.
Closing the loop: feedback, incident postmortems and continuous improvement
Quality monitoring only works if you close the loop.
Route negative feedback into your backlog as labeled examples.
Run AI-specific postmortems when incidents affect customers or regulators.
Feed insights back into prompt design, retrieval strategy and guardrails.
Over time, you’ll treat AI quality the same way you treat uptime: with SLOs, error budgets and regular reviews.
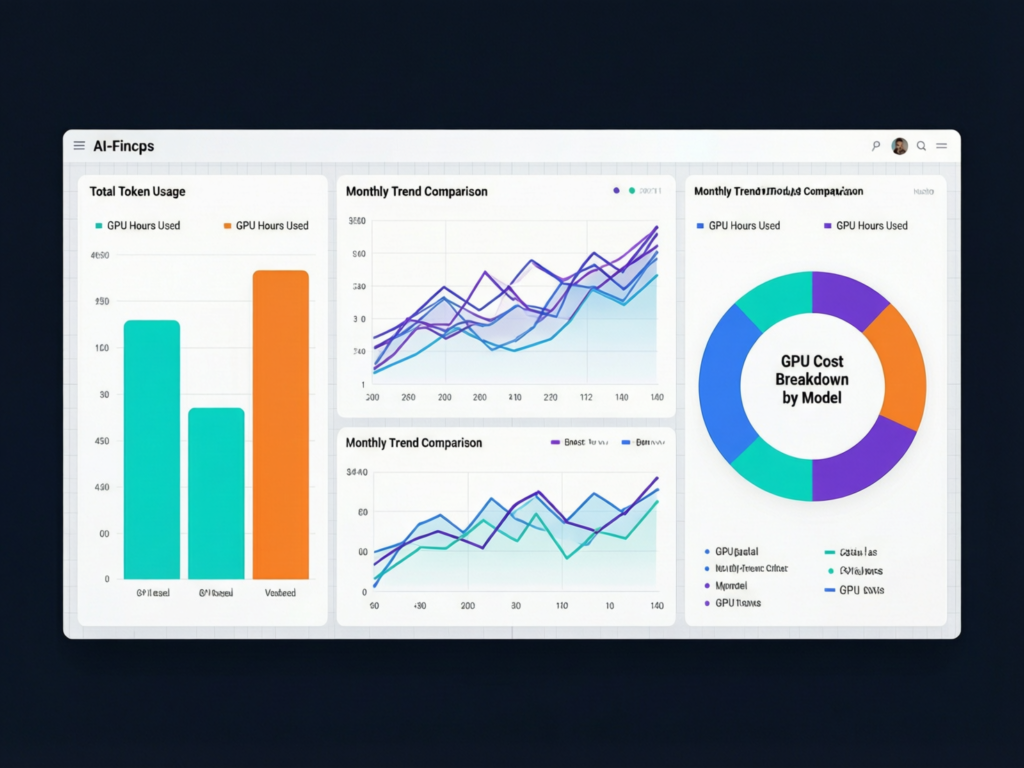
AI Cost Monitoring and FinOps for LLMs
AI cost monitoring tracks token usage, GPU/infra spend and per-feature economics so you can keep LLM quality high while staying inside budget. In many enterprises, AI spend is now a meaningful line in COGS rather than “just infra.”
What drives AI/LLM cost: models, context windows, traffic patterns
Key cost drivers:
Model choice and pricing larger, premium models with long context windows cost more per token.
Context length every extra KB of RAG context or conversation history multiplies token costs.
Traffic patterns pikes by time of day, geography or tenant; chat vs batch; internal vs external users.
Agent orchestration multi-step plans with many tool calls can easily fan out into dozens of LLM invocations.
Designing AI FinOps dashboards (per team, per feature, per user)
A practical AI FinOps dashboard might break down cost by:
Product and feature e.g., “Sales copilot”, “Claims summarization”.
Team or business unit New York underwriting vs Berlin claims.
Tenant and geography EU vs US data residency.
Environment dev / staging / production.
This mirrors cloud FinOps best practices but at the token and agent level, helping CIOs in New York City or London see which features deliver ROI and which are cost leaks.
Cost optimization playbook without sacrificing quality
Common tactics.
Model tiering route simple queries to cheaper models, complex ones to premium models.
Caching and truncation cache deterministic responses; trim unnecessary history and context.
Distillation train smaller models on logs from bigger models for high-volume use cases.
Off-peak scheduling batch non-urgent tasks in cheaper windows or to cheaper regions.
Well-instrumented AI observability lets you A/B test these tactics safely against quality metrics, not just infra costs.
AI Observability Tools and Platforms
The best AI observability tools combine tracing, evaluations, drift and cost monitoring, governance features and strong integrations with your data and cloud stack, rather than just dumping LLM logs into classic monitoring.
Evaluation criteria for AI observability tools
When shortlisting platforms (including vendors like Monte Carlo and others), look for:
Rich LLM traces (prompts, responses, embeddings, context, tools).
Built-in drift detection and quality metrics.
Role-based access control, masking and PII redaction for regulated sectors.
Governance features lineage, model catalog and audit trails.
Open source vs managed AI observability
Open source maximum control and data residency flexibility (valuable in Germany and EU), but higher internal TCO and maintenance.
Managed SaaS faster time-to-value, opinions baked in, but you must assess data residency, encryption and contractual controls especially under GDPR and the EU AI Act.
Many teams start with open-source tracing plus bespoke dashboards, then move to a managed platform once AI workloads expand.
Mapping tools to your stack (clouds, data platforms, agent frameworks)
Match tools to your environment.
Cloud stack on AWS, Azure or GCP.
Data platforms like Snowflake or Lakehouse architectures.
Agent and orchestration frameworks (LangChain, Semantic Kernel, open-source gateways).
If you’re already working with cross-cutting analytics and BI via Mak It’s Business Intelligence services, AI observability data can feed those same dashboards to give leadership a single view across performance and risk.
AI Observability for US, UK, Germany and EU
The core AI observability stack is broadly similar worldwide, but teams in the US, UK, Germany and EU must align monitoring with local data-residency, privacy and sector regulations.
HIPAA, PCI DSS and SOC 2-driven observability
In US healthcare, the HIPAA Security Rule requires appropriate administrative, physical and technical safeguards to protect electronic protected health information (ePHI), which strongly influences how you log and monitor AI systems that touch patient data.
In US fintech and SaaS, PCI DSS and SOC 2 expectations drive strict access controls, encryption and auditability for AI logs, especially where models see card data or transaction metadata.
UK and EU: GDPR, UK-GDPR, Open Banking / PSD2 and the AI Act
In the UK and EU, GDPR governs how you process personal data, including model logs and telemetry, and regulators are increasingly focused on AI-related processing and data minimization.
The EU AI Act introduces a risk-based framework for AI systems, with high-risk applications expected to maintain robust monitoring, logging and incident reporting across their lifecycle.
For London and EU banks, Open Banking/PSD2 requirements mean your AI observability design must complement existing transaction monitoring and security operations.
DSGVO, BaFin-regulated workloads and local data centers
German financial institutions supervised by BaFin often demand stricter audit trails, region-locked telemetry and continuous monitoring of cloud providers’ security posture. (BaFin)
In practice, that means running observability components in German regions, limiting cross-border transfers of AI traces, and giving internal audit and risk teams self-service access to monitoring data.
Governance, Risk and Compliance in AI Observability
A mature AI observability program doubles as a governance layer: it provides the audit trails, lineage and policies regulators and internal risk teams expect for high-stakes AI systems.
Linking AI observability with model risk management
In regulated sectors (banking, insurance, healthcare), model risk management frameworks require a model inventory, classifications (e.g., high/low risk), approvals and ongoing monitoring. AI observability feeds that loop by providing quantitative evidence of performance, drift and incidents across the lifecycle. (Monte Carlo Data)
Audit trails, lineage and explainability for regulators and customers
Your observability stack should let you answer:
Which version of which model made this decision?
With what input data, prompts, retrieval context and parameters?
Who changed the system last and why?
This is exactly the kind of evidence regulators expect after an incident, and what enterprise customers will increasingly demand in contracts and RFPs.
Designing alerts and runbooks for cross-functional teams
AI incidents are inherently cross-functional: data engineers, ML engineers, SRE, security, legal, compliance and product all have a stake. Your runbooks should clarify ownership (“who is on point when drift breaches a threshold in the UK risk model?”) and escalation paths. AI observability provides the shared, factual view they work from during those incidents.
Standing Up AI Observability in 90 Days
Start small with one critical AI use case, instrument the full pipeline end to end, ship a shared dashboard, and expand coverage across regions and products in waves.
Discover, baseline and prioritize use cases
Inventory all AI, LLM and agent-powered applications across your portfolio.
Map their “blast radius”: which affect regulated data, revenue or safety?
Prioritize a high-value pilot, such as a customer support bot or risk scoring model, ideally one already in production in New York or London.
Instrumentation, dashboards and alerts
Add AI-aware tracing, evaluations, drift metrics and cost telemetry to the pilot.
Integrate with your existing observability stack and incident tooling.
Ship a shared dashboard that leadership and on-call responders can understand in one glance (quality, drift, cost, safety)
Scale across regions and teams (US, UK, Germany, EU)
Roll out the pattern to additional use cases, then to whole business lines.
Stand up a governance council (data, risk, security, product) that owns global standards.
Decide when it makes sense to adopt or upgrade to a dedicated AI observability platform, especially once you’re operating across multiple clouds and regions.
Final Words
AI observability turns your AI stack from ingestion to agents into something you can see, question and improve, not a black box. When you unify drift detection, quality monitoring and AI FinOps on one pane of glass, you shorten incident response time, reduce wasted spend, and build regulatory-grade evidence that your AI is under control.
For teams across San Francisco, London, Berlin and beyond, that’s quickly becoming a must-have, not a nice-to-have.
Are you ready for AI observability?
You’re ready to invest seriously in AI observability if:
You have at least one AI/LLM system in production with real customers.
You can’t currently explain why quality, cost or latency changed last week.
You use different dashboards for infra, quality and cost.
You operate across multiple regions (US/UK/EU) and face complex compliance needs.
Executives are asking for AI ROI and regulators are asking for documentation.
How to evaluate a platform or run a pilot
Start by running a 90-day pilot on a single but important AI use case. Define clear success metrics (reduced drift, better task success, improved cost visibility), then evaluate tools open source or managed—that can get you there fastest.
If you already work with Mak It Solutions for analytics, cloud or app development, this is a natural moment to explore how AI observability can plug into your existing web development, mobile app development, e-commerce, or SEO stacks, and how our team can help you design the right architecture.
If you’d like help turning this playbook into a concrete AI observability roadmap, the team at Mak It Solutions can work with your data, engineering and compliance leads to scope a 90-day pilot. We’ll help you instrument drift, quality and cost, wire everything into your existing cloud and observability tools, and design dashboards your CIO and regulators can actually use.
Explore our Business Intelligence services or latest blogs for more on AI, data and analytics or reach out to request a scoped estimate for your AI observability rollout.( Click Here’s )
FAQs
Q : How does AI observability relate to data observability and MLOps?
A : AI observability sits on top of data observability and MLOps, not instead of them. Data observability focuses on the health of your data pipelines freshness, schema, quality while MLOps covers how you train, deploy and manage models. AI observability adds a layer that connects data, models, LLM prompts, agents, user outcomes and cost into one end-to-end view. In practice, you’ll reuse a lot of your MLOps and data monitoring foundation, then extend it with LLM traces, evaluations and governance features.
Q : What AI observability metrics should a CIO or Head of Data track on a single dashboard?
A : A practical executive dashboard typically tracks: task success rate, user satisfaction, hallucination or safety incident rate, drift indicators, latency, availability and cost per transaction or feature. For regulated businesses, you might add high-risk system uptime and compliance exceptions (e.g., number of AI incidents under review). The goal isn’t dozens of charts; it’s a small set of metrics that show whether AI is reliable, safe and delivering ROI in each region.
Q : How can startups implement AI observability on a tight budget before buying a full platform?
A : Early-stage teams can start with lightweight building blocks: structured logs of prompts and outputs, OpenTelemetry traces, a small eval suite, and a simple BI dashboard (even in a spreadsheet or basic BI tool). You can then add open-source libraries for drift detection and LLM evals, and only bring in a commercial platform once volume, complexity or compliance demands it. This keeps burn low while still giving founders and CTOs real visibility into drift, quality and cost.
Q : What’s the difference between open source AI observability tools and managed SaaS platforms?
A : Open source tools give you full control over data, flexible deployment (including on-prem in Germany or EU-only regions) and no per-seat SaaS contracts—but they require engineering time to integrate, operate and extend. Managed SaaS platforms offer opinionated features out of the box, strong integrations and faster setup, but you must assess data residency, encryption, vendor lock-in and pricing carefully. Many enterprises run a hybrid model, mixing open tooling with one or two strategic platforms.
Q : How often should AI teams review drift and quality reports for regulated use cases in banking or healthcare?
A : For high-risk systems in banking or healthcare, at least weekly human review of drift, quality and incident reports is a good starting point, with automated alerts in between. Under the EU AI Act and sector regulations, genuinely high-risk systems may require near-continuous monitoring and prompt incident reporting, while lower-risk cases can be reviewed less frequently. Align frequency with the risk level of each use case and document your policy so regulators and auditors can see you’re monitoring proportionately.