

BI vs Analytics vs Reporting
If your team debates “BI vs Analytics vs Reporting” every sprint, you’re not alone. The terms are often used interchangeably, but they solve different problems and require different skills, tools, and data maturity. In this guide, we unpack BI vs Analytics vs Reporting with crisp definitions, side-by-side differences, concrete examples, and a simple decision framework. By the end, you’ll know which capability to deploy, when, and why so your roadmap (and budget) matches the outcomes you care about.
TL;DR: Reporting tells you what happened, BI helps everyone monitor and understand performance now, and Analytics explains why it happened and what to do next. Keep reading for an at-a-glance table, tooling map, and “first 90 days” plan to operationalize BI vs Analytics vs Reporting without creating more dashboards no one uses.
BI vs Analytics vs Reporting at a glance
Before we dive into detail, here’s the short version of BI vs Analytics vs Reporting:
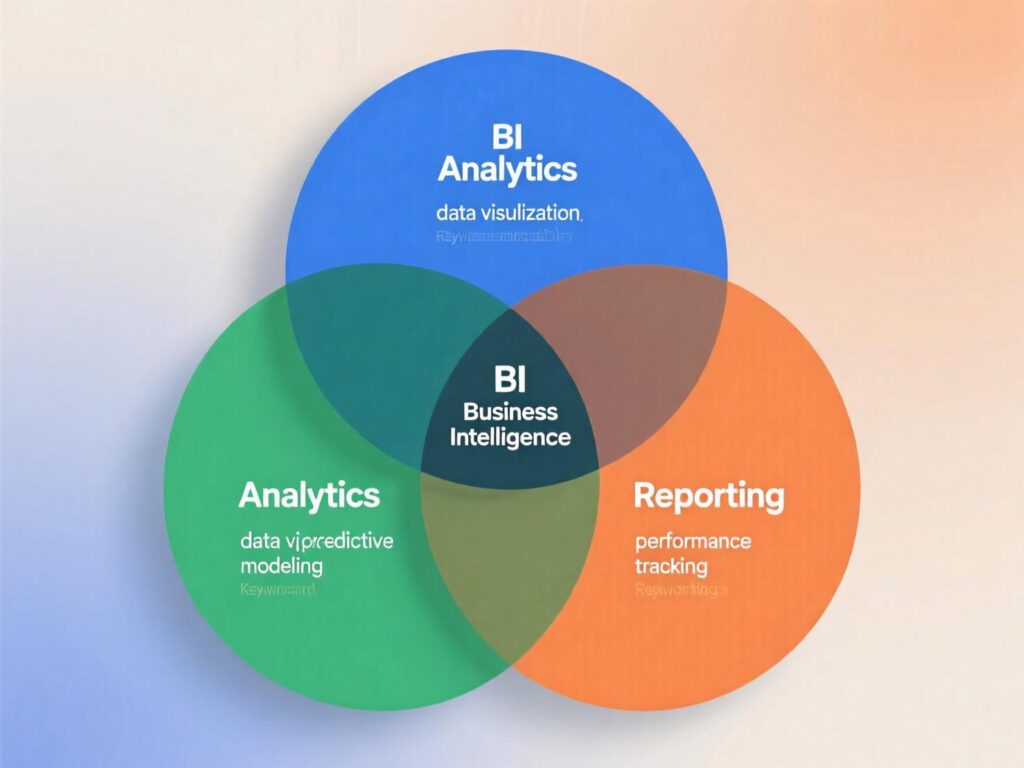
Reporting: Predefined, recurring summaries (tables/charts) that present data—e.g., daily revenue report.
Business Intelligence (BI): A platform and practice that enables access, exploration, and sharing of trusted data (dashboards, governed metrics, self-service).
Analytics: Deeper analysis and models (diagnostic, predictive, prescriptive) to answer why and what next.
Authoritative references align with this split: Gartner describes analytics as statistical/mathematical techniques that predict likely scenarios, while ABI (analytics & BI) platforms provide self-service access to approved data, visualization, and reporting capabilities for non-technical users.
Definitions you can use with stakeholders
Reporting (What)
Reporting is the recurring presentation of data in a structured format (tables, charts, KPIs) against known questions. Think: “Yesterday’s sales by region vs goal.” Tools like Google Analytics explicitly frame reports as ways to monitor and understand activity.
Business Intelligence (Now)
Business Intelligence (BI) is the combination of applications, infrastructure, data models, and practices that enable people to access and analyze information to improve decisions often through governed dashboards, metrics layers, and self-service exploration.
Analytics (Why / What next)
Analytics goes deeper: statistical analysis, experimentation, machine learning, and scenario modeling used to diagnose drivers, forecast outcomes, and optimize actions.
Put simply: Reporting = delivery, BI = enablement, Analytics = explanation + prediction. Keep this mental model front-and-center whenever comparing BI vs Analytics vs Reporting.
BI vs Analytics vs Reporting: key differences (table)
| Dimension | Reporting | Business Intelligence (BI) | Analytics |
|---|---|---|---|
| Primary question | What happened? | How are we performing now? | Why did it happen? What will happen? What should we do? |
| Time horizon | Past (fixed periods) | Mostly present (with history) | Past → future (scenarios) |
| Interactivity | Low | Medium/High (filters, drill) | High (ad hoc, modeling, code/ML) |
| Users | Execs, managers | Whole org (self-service) | Data analysts/scientists, PMs |
| Outputs | PDF/email, static dashboards | Metrics catalog, governed dashboards | Notebooks, experiments, models |
| Tooling examples | GA4 reports, scheduled SQL exports | Power BI, Tableau, Looker | Python/R, notebooks, ML platforms |
| Data requirements | Clean aggregates | Modeled, governed data | Feature-ready datasets |
Notes & sources:
Power BI docs emphasize governed dashboards and sharing; Google Analytics positions reports for monitoring; Gartner defines ABI as platforms enabling analysis, visualization, and reporting for non-technical users. Microsoft Learn+2Google Help+2
When to use BI vs Analytics vs Reporting
Use this quick mapping whenever a stakeholder asks for “a dashboard”:
Choose Reporting
when the question is stable, the metric is agreed, and the cadence is predictable.Choose BI
when multiple teams need trusted, self-serve access to shared metrics (e.g., exec scorecards, product/ops monitors).Choose Analytics
when you must identify drivers, test hypotheses, forecast, or optimize (e.g., CAC drivers, churn risk, price elasticity).
Tip: If requirements include “one-click download and email to 50 people,” it’s probably Reporting. If you hear “single source of truth” and “governed definitions,” it’s BI. If you see terms like regression, uplift, attribution, forecasting, it’s Analytics. This practical differentiation keeps BI vs Analytics vs Reporting conversations grounded.
Real-world mini-examples
Retail revenue dip:
Reporting:
Daily revenue vs target shows –8% week-over-week.BI:
A “Sales Health” dashboard lets regional managers drill into categories/locations, using governed metrics.Analytics:
A regression model finds price sensitivity + inventory gaps drive most of the decline; prescribes a promo only for SKUs with sufficient stock. (Pattern consistent with Gartner’s framing of analytics for prediction/optimization. )
SaaS activation:
Reporting:
Weekly activation rate report by cohort.BI:
Product team self-serves funnel views with consistent event definitions.Analytics:
An uplift model tests onboarding variants; changes boost activation by 4–6% in A/B tests.
Tooling map: where Reporting, BI, and Analytics live
Reporting:
GA4 standard reports; scheduled SQL/PDF; operational app exports.BI:
Power BI, Tableau, Looker governed datasets, dashboards, and sharing (the essence of ABI).Analytics:
Python/R, notebooks, ML platforms; data mining and “what-if” analyses fall here.
Don’t pit tools against each other. Healthy data orgs combine all three. Google Trends is useful to monitor macro interest across terms (e.g., “business intelligence,” “data analytics,” “reporting”), but it measures search interest, not product usage use it as one input in planning.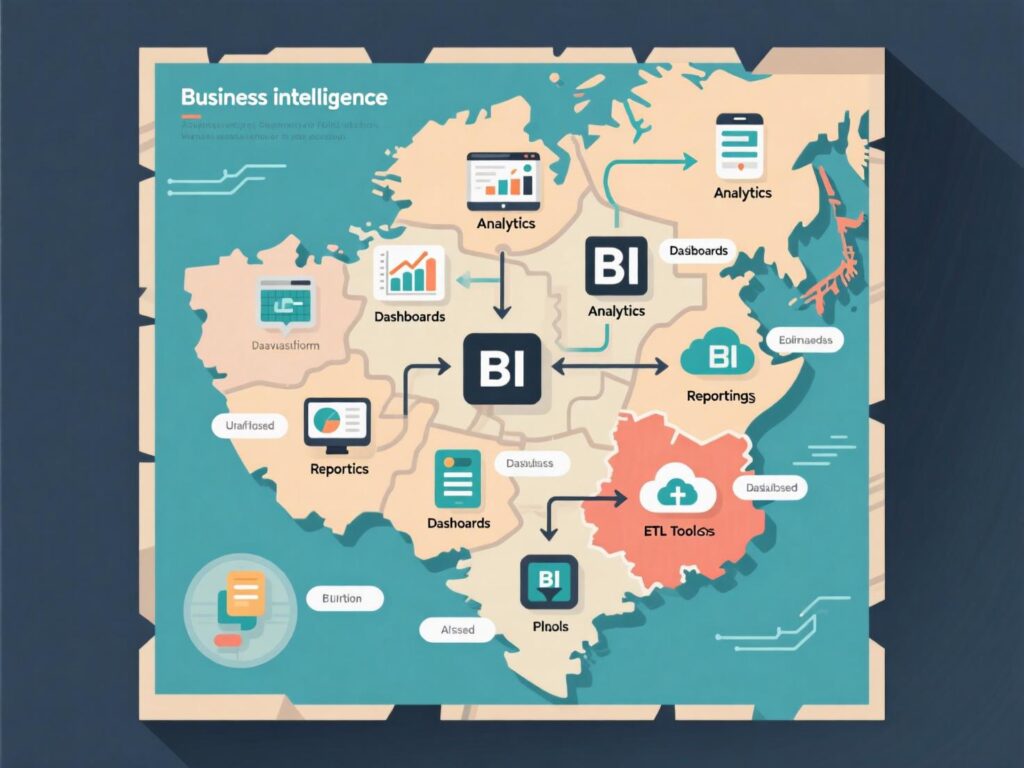
Governance & the metrics layer
Most “dashboard sprawl” problems are really definition problems. Create a metrics catalog with owners, formulas, grain, and refresh cadences. In BI, this catalog becomes your single source of truth, while Reporting subscribes to it and Analytics extends it with feature-ready datasets. (Gartner’s ABI notes the importance of non-technical access to approved data and reporting.)
Skills and org design
Reporting:
BI devs, analysts, ops specialists.BI:
Analytics engineers, data modelers, enablement leads, product owners.Analytics:
Data analysts/scientists with statistics/ML, experimentation, and causal inference chops.
Balance investment across BI vs Analytics vs Reporting according to your strategy; over-weighting any one creates bottlenecks.
Common pitfalls (and how to avoid them)
Dashboards ≠ decisions.
Tie every BI artifact to a decision and an owner.
Un-governed metrics.
Publish a dictionary, review definitions quarterly.
DIY chaos.
BI self-service without a guided layer causes “multiple truths.”
Analysis theater.
Analytics models without deployment plans won’t move KPIs.
Email as a platform.
Reports die in inboxes—schedule sparingly; prefer live links with alerts.
Power BI documentation highlights sharing, access control, and workspace practices—use them to curb sprawl.

A simple 5-step “How-to” to choose correctly
Write the question
(what decision, by whom, by when).
Classify it as what / how now / why & what next → maps to Reporting / BI / Analytics.
Select metric sources
(governed datasets for BI; feature tables for Analytics).
Choose output
(report schedule; BI dashboard; analysis doc/model with recommendation).
Assign ownership & SLA
(refresh cadence, review cycle, deprecation rules).
This repeatable process is your operating system for BI vs Analytics vs Reporting decisions.
Case studies (brief & concrete)
Consumer subscription app:
A PM blamed ads for churn. Analytics showed time-to-value was the culprit; shortening onboarding lifted 30-day retention by 5%. BI dashboards made this visible to marketing, so Reporting on spend was de-prioritized until activation improved.Multi-brand retailer:
Leadership demanded more reports. An enablement lead invested in a BI metrics layer; report count dropped 40% while usage and NPS rose. Later, Analytics models optimized markdown timing, protecting margin in shoulder seasons.
Putting it together: a maturity model
Stage 1 — Reporting-heavy: Lots of CSVs/PDFs, little trust.
Stage 2 — BI foundation: Central models, governed dashboards, metric catalog.
Stage 3 — Analytics-driven: Experimentation, forecasting, decision automation.
Gartner’s ABI framing supports evolving from access/visualization to decision optimization—your roadmap should, too.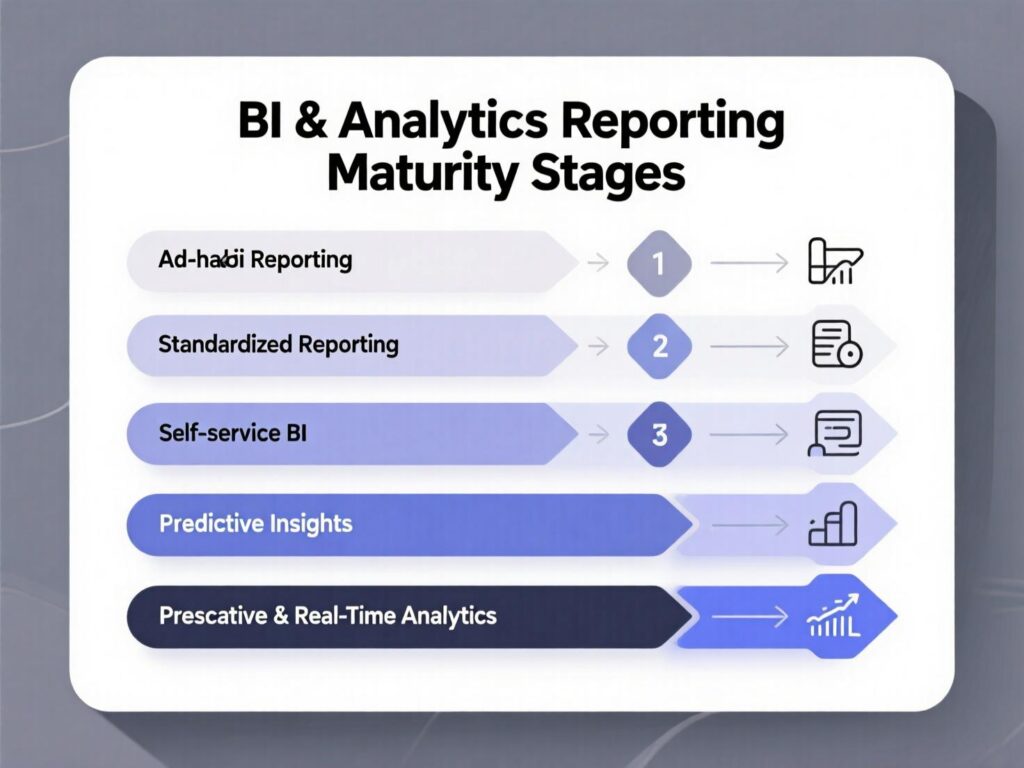
Last Words
You don’t need more dashboards you need clarity of purpose. Use Reporting for stable, recurring summaries. Use BI to enable the whole org with governed, shared truths. Use Analytics to uncover drivers, run experiments, and decide what to do next. Start with the 5-step method above, and you’ll deploy BI vs Analytics vs Reporting with confidence and measurable business impact.
CTA: Want a customized blueprint (tools, roles, 90-day plan) that fits your stack? Reach out and we’ll map BI vs Analytics vs Reporting to your goals, tech, and team size.
FAQs
Q : What is the difference between reporting and BI?
A : Reporting distributes predefined summaries; BI is an enablement layer governed data models, dashboards, and self-service access that help people monitor and explore performance. (See Microsoft Power BI docs for how BI centralizes and shares insights.)
Q : Is analytics part of BI?
A : Often, yes many vendors group them as ABI (analytics & business intelligence) but analytics uses deeper methods (statistics/ML) for why/what next, while BI ensures trusted access and exploration.
Q : How do I decide between BI vs Analytics vs Reporting?
A : Classify the question: what happened → Reporting; how are we performing now → BI; why and what next → Analytics. Then pick the right output (scheduled report, governed dashboard, analysis/model).
Q : How can reporting, BI, and analytics work together?
A : Use BI as the governed backbone, reporting as distribution of key summaries, and analytics to improve the system with experiments and models—with shared definitions across all three.
Q : How does Google Analytics fit here?
A : GA4 offers reports to monitor behavior; use BI tools to blend GA with revenue, inventory, or CRM; use analytics to model attribution or predict churn.
Q : How do governance and a metrics layer help?
A : They create a shared vocabulary—every KPI has an owner, formula, and grain—reducing conflicting dashboards and supporting reliable BI vs Analytics vs Reporting outcomes.
Q : How can I avoid “dashboard sprawl”?
A : Attach every dashboard to a decision and owner; prune quarterly; favor alerts over email PDFs; enable self-service with clear metric definitions.
Q : How does data mining relate to analytics?
A : Data mining discovers patterns and correlations in large datasets; those techniques feed analytics by identifying features and hypotheses for further testing.
Q : How should I staff for all three?
A : Pair analytics engineers (BI), business analysts (reporting), and data scientists (analytics) under a product-style roadmap, with shared SLAs for metrics and datasets.