The Complete Guide to Business Intelligence Services
The Complete Guide to Business Intelligence Services
Introduction:
If your data lives in ten tools and thirty spreadsheets, decisions will always lag behind. Business intelligence services bring your data together, standardize KPI definitions, and give teams governed, self-service dashboards so leaders can act in minutes—not months.
In short, business intelligence services include strategy, data integration, modeling, dashboarding, and enablement delivered by specialists on platforms like Power BI, Tableau, Looker, and Qlik. This guide shows you exactly what’s included, how to choose a vendor, typical costs in the US & Europe, and a 90-day roadmap to first value.
What Are Business Intelligence Services?
Business intelligence services are end-to-end consulting and managed services that transform raw, scattered data into trusted, actionable insights for decision makers. They span data strategy and governance, ETL/ELT pipelines, cloud data warehousing, semantic modeling, KPI design, dashboard development, and user enablement—plus ongoing support to keep analytics reliable and secure.
Core Scope: From Data Integration to Decision Support
A typical scope covers:
Data Strategy & Governance: Policies, roles, and standards for quality, lineage, security, and access.
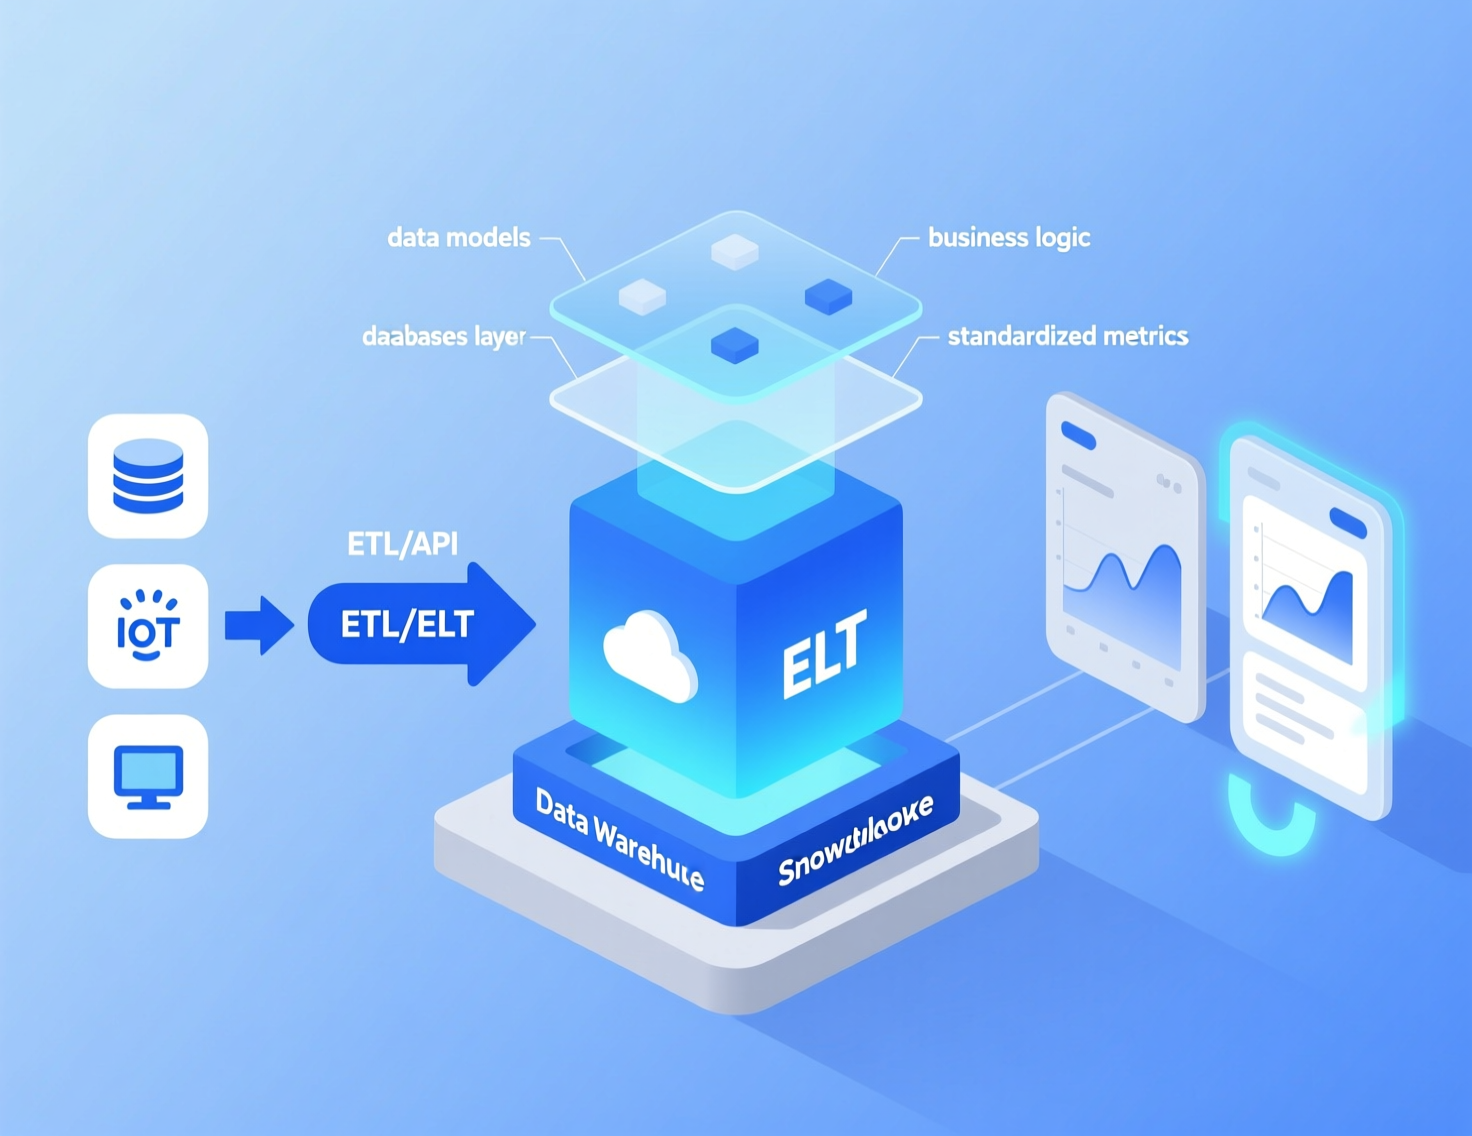
Integration (ETL/ELT) & Warehousing: Ingesting sources (ERP, CRM, e-commerce, finance) into a cloud data warehouse and modeling a single source of truth.
Semantic Models & Metrics: Reusable, governed definitions for revenue, margin, pipeline, churn, and more.
Dashboards & Self-Service: Department-specific KPI dashboards with governed datasets and role-based access.
Enablement & Adoption: Training, playbooks, and change management so non-technical users get value.
For formal definitions of ABI (Analytics & BI) platforms—the software backbone that supports these services—see Gartner’s market overview.
BI vs. Data Analytics Consulting: Where They Overlap & Differ
There’s overlap, but the emphasis differs:
BI consulting focuses on governed metrics, dashboards, reporting, and self-service decision support (often department or enterprise wide).
Data analytics consulting leans into exploratory analysis, data science, forecasting, and experimentation (often with notebooks and ML).
Many buyers blend both—standing up BI for standardized decisions while engaging analytics teams for advanced forecasting and simulations.
Business Outcomes BI Enables
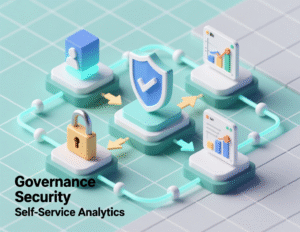
When done right, business intelligence services deliver measurable outcomes: faster time-to-insight, higher forecast accuracy, consistent KPI definitions, and broad self-service analytics. For example, leadership dashboards reduce weekly manual reporting cycles and expose “why” not just “what,” while governed datasets curb spreadsheet sprawl and audit risk. Moreover, clear ownership, data catalogs, and access policies support compliance (e.g., GDPR for EU data subjects).
Service Catalog & Deliverables
Data Strategy, Governance & Architecture
Deliverables typically include a data strategy, an operating model (roles like data owner, steward, custodian), data quality rules, retention policies, and a security architecture aligned to SOC 2 and ISO/IEC 27001 best practices—especially important for regulated industries and cross-border teams.
Actionable tip: Start with a 6–8 week discovery to catalog sources, map PII flows, and define KPI “source of truth.” In Europe, confirm data transfer mechanisms and territorial scope interpretations under GDPR before moving workloads across regions.
ETL/ELT, Warehousing & Semantic Modeling
Teams implement ingestion (batch/stream), transformation in dbt or native cloud tools, and a warehouse (e.g., Azure SQL/ Synapse, BigQuery, Snowflake, Amazon Redshift). A semantic layer (in Power BI, Looker’s models, or a headless metrics layer) standardizes business logic so every dashboard uses the same metric math.
Real-world example: A retail brand consolidates POS, e-commerce, and marketing data into a star schema and exposes a “Gross Margin” metric through the semantic model so Finance and Merchandising tell the same story.
KPI Design, Dashboards & Self-Service Enablement
Deliverables include a KPI tree, executive and operational dashboards, and governed datasets supporting ad-hoc analysis. Expect role-based access, row-level security, and usage telemetry to monitor adoption. Run enablement clinics for power users and lunch-and-learns for executives.
Why an Implementation Roadmap Is Critical
A roadmap sequences dependencies (data quality first), mitigates scope creep, and aligns stakeholders on milestones such as “First 10 KPIs live” and “Self-service cohort trained.” Gartner peer-insight lessons emphasize stakeholder engagement, POCs, and training as critical success factors—validating why a roadmap matters.
Platform-Specific Services
Microsoft Power BI Consulting Services
Power BI is broadly adopted in Microsoft-centric stacks (Azure, Fabric, Office 365). Services include Fabric architecture, dataflows, DAX modeling, governance (workspaces, sensitivity labels), and PPU/Premium capacity planning. Microsoft was recognized as a Leader in the 2025 Gartner Magic Quadrant for Analytics & BI Platforms, highlighting execution and vision.
Licensing note: Power BI Pro is ~$10 per user/month, with Premium Per User add-ons unlocking larger models and advanced capabilities—useful inputs for TCO modeling.
Tableau, Looker & Qlik: When Each Fits Best
Tableau (Salesforce): Best-in-class visual exploration and design flexibility; named a Leader in recent Magic Quadrants. Great for organizations prioritizing visual analytics and cross-cloud deployments.
Google Looker: Strongly governed semantic modeling and embedded analytics on Google Cloud; recognized as a Leader in 2025.
Qlik: Associative engine and robust data integration lineage; a 15-year Leader in the Gartner MQ. Ideal for complex data discovery and hybrid estates.
Recommendation: Shortlist 2–3 platforms and run a two-week “thin slice” POC against real KPIs (not demo data) to validate governance, performance, and embedded needs.
Migrations & Modernization: Legacy BI to Cloud
Common patterns include:
SSRS/Cognos/BO to Power BI/Tableau/Looker: Re-model first, then migrate priority reports.
On-prem to Cloud DW: Lift-and-shift isn’t enough; redesign for columnar storage, partitioning, and incremental loads.
Metric Layer Standardization: Move calc logic out of reports into a governed model to cut maintenance.
Govern data transfers for EU data subjects (e.g., processing bases and international transfer mechanisms) and align with SOC 2/ISO controls to pass enterprise security reviews.
Use Cases, Industries & ROI
Finance & FP&A: Executive Dashboards, Forecasting, Margin Tracking
Use cases: consolidated P&L, working capital views, SKU-level margin waterfalls, scenario planning. Example: a multinational builds a CFO cockpit with automated actuals vs. forecast and a rolling 13-month cash view; monthly close reporting drops from 5 days to 2. Tie this to a governed semantic model so FP&A and Sales Ops share the same revenue recognition logic.
Healthcare & Life Sciences: Compliance, Quality, Population Health
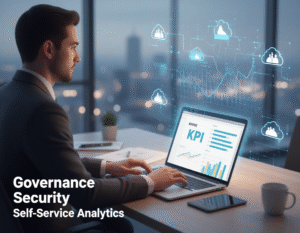
Use cases: patient flow, readmission rates, referral leakage, clinical quality measures, and lab throughput. Strict access controls and audit trails support privacy laws and EU GDPR principles like data minimization and purpose limitation.
SMEs & Mid-Market: Fast Wins with Prebuilt Templates
Small and mid-size firms often start with prebuilt templates—sales pipeline, marketing performance, inventory turns—to reach value in weeks. On platforms like Power BI, templated semantic models plus role-based dashboards let a 50–250 person company achieve governed self-service analytics without a large data team.
Measuring ROI: Time-to-Insight, Adoption, Cost Avoidance
Adopt a simple framework:
Time-to-Insight: Baseline manual reporting hours; target 50–80% reduction.
Adoption: Measure monthly active users per department; aim for >60% of licensed users.
Cost Avoidance: Retire duplicate tools, reduce data prep effort, cut spreadsheet risk, and avoid compliance penalties through governance.
Use platform usage telemetry and project OKRs to monitor each metric continuously.
How to Choose a BI Consulting Firm
Evaluation Criteria: Certifications, Case Studies, Data Security
Shortlist firms with demonstrable certifications (e.g., Microsoft Solutions Partner, Tableau/Looker/Qlik partner), case studies in your industry, and verified security posture (SOC 2, ISO/IEC 27001). For EU programs, ask about GDPR controls and data residency—including where PII is stored and processed. Reference independent directories to benchmark vendors: Clutch profiles and reviews, and Consultancy.eu rankings for Europe.
Security/compliance resources you can cite internally during reviews: AICPA’s SOC guidance, ISO 27001 standard overview, and GDPR territorial scope guidelines.
Questions to Ask in Discovery Calls
Which business outcomes will you commit to in 90 days (e.g., “10 executive KPIs live”)?
How do you define and govern KPI semantics across tools?
What’s your plan for user adoption (training, office hours, champions)?
Can you run a platform-agnostic POC and explain tradeoffs between Power BI vs. Tableau vs. Looker vs. Qlik for our needs? (Cite current MQ placements and partner credentials.)
How do you design for GDPR data residency (EU) and handle US/EU data transfers?
In-House vs. Outsourced BI: Hybrid Models That Work
In-house core + external specialists: Keep product owners and data stewards inside; bring in architects/modelers for accelerators.
Managed BI: A vendor runs pipelines, models, and releases under SLAs—ideal when you need steady velocity without adding headcount.
Staff Augmentation: Plug specific gaps (e.g., DAX or LookML) during peak delivery cycles.
Pricing, Engagement Models & Timelines
Typical Cost Ranges in the US & Europe
Budget drivers: data sources/volume, security scope, platform mix, and adoption program. Market indicators you can use to sanity-check budgets:
Consultant labor: US BI consultants commonly earn $55–$67/hour on average (salary-based indicators), with freelance BI analysts often billed ~$25–$55/hour on marketplaces. Bill rates from firms will be higher to cover overhead/expertise.
Per-dashboard builds: Public ranges vary widely; several firms quote $5k–$50k+ depending on complexity.
End-to-end implementations: Public calculators cite $80k–$1M+ depending on enterprise scope. Use these only as directional anchors—validate with your discovery.
Geo nuance: US hubs like New York, Austin, San Francisco typically price higher than EU hubs like London, Dublin, Amsterdam, Berlin for equivalent roles due to wage and overhead differences—plan contingencies accordingly (and consider near-shore EU for data residency alignment).
Fixed-Scope, T&M, and Managed BI Services
Fixed Scope: Milestone-based, clear deliverables (great for quick wins like “Executive Dashboard v1”). Risk: change requests.
Time & Materials: Flexibility for evolving requirements; govern with weekly demos and burn-up charts.
Managed BI (Monthly): Outcome SLAs (uptime, data freshness, backlog throughput), includes platform ops, enhancements, and support.
Sample 90-Day Plan: From Assessment to Go-Live
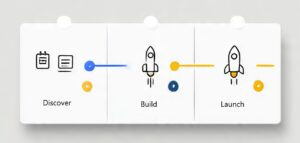
Days 1–30: Discover & Design
Source inventory, KPI interviews, security & GDPR review, platform fit POC.
Days 31–60: Build the Backbone
Ingest 3–5 sources, create core star schema, define 10 KPIs in the semantic layer, design executive dashboard.
Days 61–90: Launch & Enable
Pilot go-live, train champions, usage telemetry, backlog for next 90 days.
This plan doubles as a How-To for internal governance and change management.
Summary / Key Takeaways
What BI services include: strategy, governance, ETL/ELT, warehousing, semantic modeling, KPI dashboards, and enablement.
Tool fit: Power BI for Microsoft stacks; Tableau for visual exploration; Looker for governed semantic models; Qlik for associative discovery.
Selection checklist: certifications, case studies, security attestations (SOC 2/ISO 27001), GDPR/data residency approach, references on Clutch/Consultancy.eu.
Cost ranges: directionally, $5k–$50k+ per complex dashboard; $80k–$1M+ for enterprise programs; labor costs vary by region and role.
Roadmap: a 90-day plan to first value (10 KPIs live + trained champions) de-risks adoption, and aligns stakeholders.
Ready to turn scattered data into decisions? Mak It Solutions delivers end-to-end business intelligence services across Power BI, Tableau, Looker, and Qlik—tailored to US and European compliance needs. Book a 30-minute roadmap workshop with our Editorial Analytics Team to get your prioritized 90-day plan and first 10 KPIs live. Contact us through the form. Click Here.
FAQs:
1) What is the typical timeline for a BI implementation from kickoff to first dashboard?
Most mid-market projects reach their first executive dashboard in 6–10 weeks if data sources are accessible and KPI definitions are agreed early. A pragmatic 90-day plan usually includes discovery (weeks 1–4), core modeling and pipeline setup (weeks 5–8), and pilot go-live with training (weeks 9–12). Expect faster cycles with prebuilt templates and cloud warehouses; allow extra time for complex security, late data access, or change management. Align each phase to measurable outcomes (e.g., “10 KPIs live,” “>60% active users”).
2) Do I need a data warehouse, or can I connect BI tools directly to source systems?
Direct connections work for small, single-source use cases, but scaling across departments benefits from a warehouse or lakehouse (quality checks, historical snapshots, consistent joins, and performance). Warehousing also enables a semantic model so all dashboards share the same metric logic. If you start directly, plan a “phase 2” to centralize data once adoption grows, especially where GDPR retention and auditability matter in Europe.
3) How do you ensure user adoption of BI dashboards across non-technical teams?
Treat adoption as a product: form a champion network, set up role-based dashboards, run office hours, and measure usage telemetry monthly. Provide quick-hit guides and “ask me anything” sessions. Align dashboard design to jobs-to-be-done (decisions, not visuals). Finally, governed datasets reduce friction by giving analysts a safe place to answer ad-hoc questions without reinventing metrics.
4) What’s the difference between managed BI services and staff augmentation?
Managed BI delivers outcomes under SLAs (freshness, uptime, backlog velocity) and includes architecture, pipelines, modeling, dashboards, and support. Staff augmentation bolsters your team with specific skills (e.g., DAX, LookML) but relies on your product owner and delivery process. Many buyers start with augmentation to validate fit, then transition to managed BI for predictable throughput.
5) How do BI vendors handle GDPR and data residency requirements in Europe?
Competent vendors conduct a data mapping exercise, minimize personal data, apply role-based access, and document transfer mechanisms. They design architectures to keep EU data in-region and align with recognized controls like SOC 2 and ISO/IEC 27001 during security reviews. Ask for their GDPR approach, sub-processors, and which regions host PII. Reference EU resources for responsibilities and penalties to align stakeholders early.
Key Takeaways:
Business intelligence services transform fragmented data into governed, self-service insights.
Choose platforms by fit: Microsoft ecosystems → Power BI; visual exploration → Tableau; governed modeling → Looker; associative discovery → Qlik.
Vet firms via certifications, case studies, Clutch and Consultancy.eu profiles, and security attestations.
Budget using directional ranges and validate in discovery; expect regional variance between US and EU hubs.
Use a 90-day roadmap to de-risk delivery and accelerate adoption.
