Multi-Cloud Cost Optimization That Protects Performance
Multi-Cloud Cost Optimization That Protects Performance

Multi-Cloud Cost Optimization That Protects Performance
In 2026, a multi-cloud cost optimization strategy means continuously aligning spend, performance and risk across two or more cloud providers using shared FinOps practices, unified telemetry and disciplined workload placement. Done well, it typically cuts 20–30% of cloud costs while preserving SLAs, compliance and digital sovereignty for teams in the US, UK, Germany and the wider EU.
Introduction
By 2025, around 90% of enterprises report using some form of multi-cloud, often spanning three to five platforms. At the same time, AI and GPU-heavy workloads are pushing monthly bills into seven- or eight-figure territory for SaaS, fintech and data platforms in the United States, the United Kingdom and across the European Union. For CIOs, the problem isn’t just “cloud is expensive” it’s that spend, performance and risk are fragmented across providers.
Modern multi-cloud cost optimization has shifted from coupon-clipping to serious financial operations. Recent State of FinOps data shows reducing waste and managing commitment discounts are now the top priorities for practitioners, overtaking “empowering engineers” for the first time.In parallel, analysts forecast the global multi-cloud management market to grow from roughly $20B in 2026 to well over $100B by the early 2030s.
This guide gives you a practical playbook to cut multi-cloud spend by 20–30% without breaking SLAs, sacrificing performance or triggering cloud repatriation you’ll regret in two years. We’ll focus on FinOps discipline, architecture and workload placement, and the geo-specific realities of operating in the US, UK, Germany and the wider EU.
What Is Multi-Cloud Cost Optimization in 2026?
In 2026, multi-cloud cost optimization means continuously aligning spend, performance and risk across multiple cloud providers using shared FinOps practices, unified telemetry and workload-aware placement not just trimming line items on each bill. It turns cloud from a sunk cost into a portfolio you actively manage.
Clear Definition and Scope
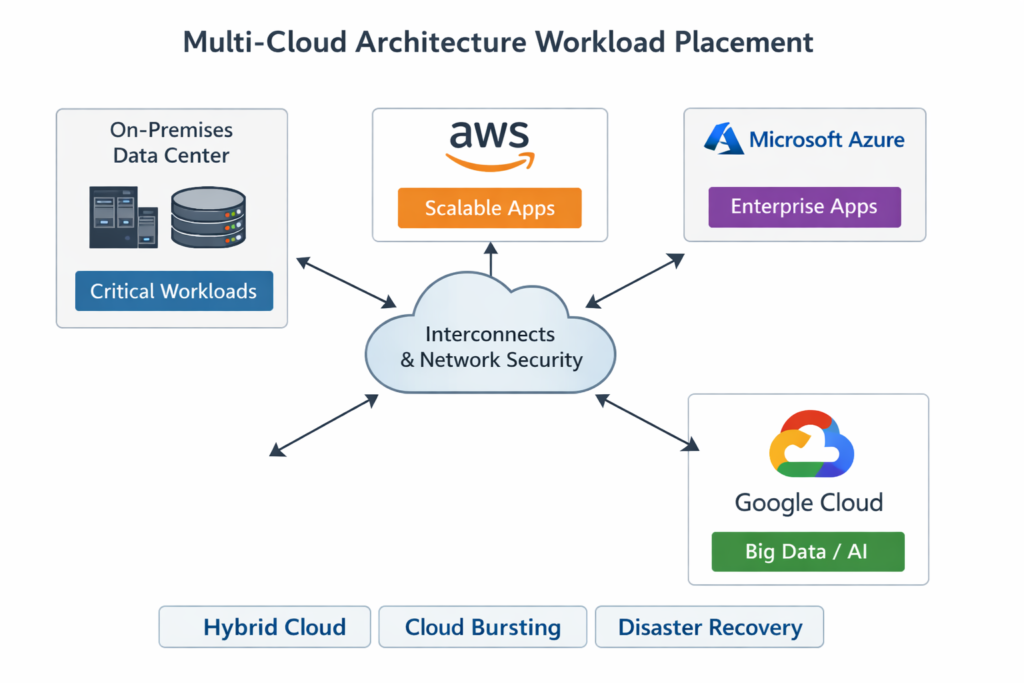
“Single-cloud” means most workloads live on one provider; “hybrid cloud” combines on-prem or colo infrastructure with at least one public cloud; “multi-cloud” means you’re deliberately using two or more public or sovereign providers in parallel for production workloads.
Multi-cloud cost optimization is therefore a cross-provider discipline. Instead of tuning only your Amazon Web Services (AWS) bill or your Microsoft Azure bill, you compare and optimize workloads that might reasonably run on Google Cloud, a European player like OVHcloud or even a sovereign platform. The goal: the right workload, on the right platform, at the right unit cost.
How Multi-Cloud Cost Optimization Differs from Generic Cloud Cost Savings
Generic cloud cost savings focus on one provider: reservations, rightsizing, autoscaling, storage tiering. Those still matter, but multi-cloud brings extra challenges.
Fragmented visibility across multiple billing systems and consoles
Different pricing and discount models (savings plans, commitments, enterprise agreements)
Overlapping services (three observability stacks, three API gateways, three managed Kafka offerings)
The only defensible way to compare is unit economics: cost per transaction, per active user, per API call, per dataset or per model inference. When you normalize to “cost per order in New York” or “cost per fraud decision in Berlin”, you can finally see which cloud is actually cheaper for that workload.
Key Metrics for Multi-Cloud Cost Performance in 2026
In 2026, the leading FinOps teams track a consistent KPI set across clouds.
Cloud TCO per workload (including platform, licenses, support and people)
Cost per environment (prod vs staging vs non-prod) to keep test sprawl visible
Cost per SLO/SLA tier (e.g., “99.99% fraud API”, “99.5% internal dashboard”)
Cost of resilience: incremental cost of multi-region, multi-cloud or active-active designs
Effective discount rate across providers, once commits, savings plans and enterprise agreements are factored in
These metrics make the “more expensive or cheaper?” debate about multi-cloud answerable in terms a CFO will actually accept.
The Business Case: Is Multi-Cloud More Expensive or Cheaper?
Multi-cloud only becomes cheaper when you actively manage commitments, eliminate waste and place the right workloads on the right platform. Left alone, it is usually more expensive and more complex.
Cost Drivers in Multi-Cloud vs Single-Cloud Setups
Direct cost drivers.
Different list prices for compute, storage, managed databases and GPUs
Network and egress fees between regions and between providers
Duplicated services: two observability platforms, multiple queues, overlapping security tools
Indirect cost drivers:
Extra engineering and operations headcount
Governance overhead (FinOps, security, risk, vendor management)
Underused commitments when workloads move faster than contracts
AI/ML and GPU workloads magnify the stakes: moving a model training pipeline from one cloud to another without thinking about discounts and data gravity can add millions per year in network and storage overhead.
Common Waste Patterns in Multi-Cloud Environments
The same waste patterns keep appearing across US, UK and EU multi-cloud estates.
Duplicated non-prod environments in every region and provider
“Zombie” resources: forgotten volumes, IPs, managed clusters and endpoints
Over-provisioned managed services sized for peak that rarely arrives
Idle interconnects and direct connects between data centers and clouds
Data egress fees and exit costs become a hidden multi-cloud tax—especially when data is pulled constantly between analytics platforms, SaaS tools and cloud regions. Colocation providers have long flagged poor data gravity decisions as a leading driver of unnecessary network spend.
When Multi-Cloud Reduces Net TCO
Multi-cloud can absolutely reduce net TCO when you.
Use spot and discounted capacity where it’s safe
Negotiate stronger enterprise pricing across providers
Exploit regional price differences when latency allows
Match workloads to native strengths (e.g., analytics, AI, Windows, SAP, sovereign controls)
Resilience, vendor leverage and regulatory fit can offset the operational overhead. For example, a payment platform splitting traffic between clouds across London and Frankfurt might pay slightly more in infrastructure, but dramatically reduce regulatory and concentration risk under DORA and local banking rules.
FinOps-Led Multi-Cloud Cost Optimization Strategy
The fastest wins come from combining FinOps, automation and shared accountability, so engineering, finance and product teams all see and own multi-cloud spend.
Establish a Unified Cost Model and Operating Rhythm
Start by creating a single “multi-cloud bill” view, normalized by.
Provider
Account/subscription/project
Business unit, product and environment
Use a common tagging and account structure so your dashboards tell one consistent story. Many teams use the FinOps Framework and State of FinOps reports from the FinOps Foundation as a reference for terminology, maturity levels and operating models.
Then, set a cadence that your teams can actually keep: monthly executive reviews, weekly FinOps standups with engineering and daily or near-real-time anomaly alerts.

Optimization Levers Across Providers
Classic optimization levers still work across clouds.
Rightsize compute, databases and Kubernetes clusters
Tighten autoscaling policies and remove conservative overprovisioning
Turn off non-prod environments outside working hours (especially in US and UK time zones)
Apply storage tiering and data lifecycle rules
On top of that, multi-cloud requires commitment strategies that respect workload mobility:
Savings plans and reserved instances (AWS)
Reserved capacity and Azure Hybrid Benefit (Azure)
Committed use discounts (GCP)
Sovereign or regional commitments with European providers
The risk: over-committing on a cloud where workloads might move due to AI, latency or sovereignty decisions. A FinOps practice keeps these commitments in sync with your roadmap instead of letting sales cycles dictate your architecture.
Tooling: Native vs Third-Party Multi-Cloud Cost Management
Native tools like AWS Cost Explorer, Azure Cost Management and GCP Billing are evolving fast, but they’re still provider-centric. Third-party FinOps platforms and automated commitment managers give you:
Cross-cloud coverage and a single pane of glass
Anomaly detection, rightsizing and purchasing recommendations
Guardrails, policies-as-code and workflows that tie into BI and ticketing tools
Analysts and vendors alike highlight that automation is now essential manual management of commitments and usage doesn’t scale beyond a certain spend level.
Architecture & Workload Placement.
Most CIOs don’t abandon cloud entirely they selectively move specific workloads while aggressively optimizing the rest, using a clear workload placement framework first.
Cloud Repatriation vs Multi-Cloud Optimization in 2026
Cloud repatriation moving workloads back to on-prem or colo has reappeared on the CIO agenda due to cost overruns, sovereignty concerns, performance issues and perceived vendor lock-in.
A practical decision tree.
Optimize in place: clean up waste, rightsize, tune architecture and renegotiate contracts.
Re-platform to a better-fit cloud: move workloads to a provider with better pricing, latency or compliance.
Only then consider repatriation for specific, well-understood workloads with stable demand and clear TCO advantages on-prem.
This keeps you out of “lift-and-regret” data center projects driven purely by short-term bill shock.
Hybrid Multi-Cloud Architecture Patterns That Control Cost
Common hybrid multi-cloud patterns include.
Hub-and-spoke: central shared services in one cloud or colo, application spokes across multiple clouds
Data mesh across clouds: domain-oriented data products replicated or federated between providers
Edge + regional cloud combos for low-latency use-cases
Think of low-latency trading between London and Frankfurt, or an ERP system anchored on-prem with satellite workloads running in regional clouds near Austin or San Francisco. The architecture choice determines your floor for network and egress cost.
Handling Data Gravity, Latency and Exit Fees
To keep data gravity under control:
Use colocation hubs and direct connects to reduce unpredictable internet egress
Minimize chatty cross-cloud patterns; co-locate compute with data
Intentionally duplicate cold datasets rather than constantly streaming everything
Colo providers and interconnect platforms have long advocated this as one of the most reliable ways to rein in multi-cloud networking and egress fees.
In Europe and the UK, the economics are shifting further. The EU Data Act, which took effect in September 2025, introduces rules to make cloud switching and data portability easier, with phased reductions and eventual bans on certain switching-related fees. Google has already responded by scrapping some cloud data transfer charges for multi-cloud workloads in the EU and UK.
GEO-Specific Considerations.
The right multi-cloud cost optimization strategy is highly geo-dependent US FinOps maturity, UK public sector constraints and EU/German sovereignty rules all influence workload placement.
Multi-Cloud Cost Optimization for US Enterprises
US-based SaaS, fintech and AI companies often face:
High, variable GPU and AI inference spends
Strict obligations under HIPAA, PCI DSS and SOC 2
Mature FinOps practices with engineering already used to showback/chargeback
Here, success looks like rigorous unit economics for AI (cost per model, per inference, per user) and aggressive use of commitment-based discounts tied to growth scenarios. Articles like Mak It Solutions’ “IT Cost Optimization Strategies for 2025 CIOs” and “AI Observability: Monitor Drift, Cost and Quality” already lay the groundwork for US-style FinOps and AI cost control ideal internal reading for your teams.
UK Financial Services, Public Sector and NHS
In the UK, banking, public sector and healthcare teams balance cost, resilience and data residency under UK-GDPR and sector-specific regulations. The NHS, for example, has adopted a multi-cloud strategy using Azure, AWS and Google Cloud to serve 67 million citizens while meeting strict sovereignty expectations.
CIOs in London-region deployments often use multi-cloud for resilience and exit options, but will standardize patterns (e.g., a single observability stack and common landing zones) to keep operating overhead and vendor risk manageable.
Germany and EU.
German enterprises face DSGVO (GDPR), sensitive manufacturing IP and financial rules shaped by BaFin. BaFin’s cloud outsourcing guidance expects clear audit rights, exit plans and risk controls for cloud providers, which CIOs must factor into any multi-cloud strategy.
Across the EU, sovereign cloud is surging. Analysts expect worldwide sovereign cloud IaaS spending to reach roughly $80B in 2026, with European sovereign IaaS tripling from about $6–7B in 2025 to more than $23B by 2027. Projects like Gaia-X and France’s leadership often alongside providers like OVHcloud anchor this push for digital sovereignty.
The EU Data Act strengthens switching and portability rules, putting sustained regulatory pressure on hyperscalers and making multi-cloud more economically viable for enterprises in Germany, France, Spain and beyond.

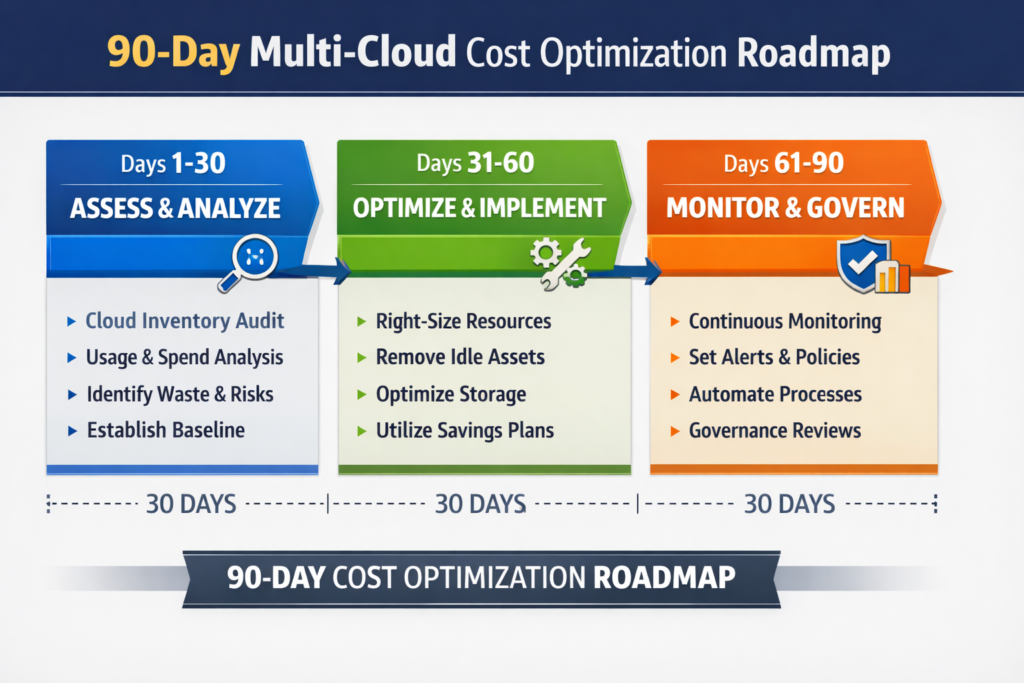
90-Day Multi-Cloud Cost Optimization Roadmap
A 90-day roadmap lets CIOs prove value fast delivering measurable savings and better performance without risky wholesale cloud exits.
Days 0–30 Baseline, Visibility and Quick Wins
Inventory all accounts, subscriptions and projects across providers
Standardize tagging (app, BU, environment, owner, geo, data classification)
Turn on showback/chargeback reports for major BUs
Enable anomaly detection, budget alerts and idle resource cleanup policies
This is where Mak It Solutions’ playbooks from “IT Cost Optimization Strategies for 2025 CIOs”, “AWS vs Azure vs Google Cloud Comparison 2025 Who Wins?” and “Identity Is the New Perimeter for Cloud IAM Security” help you align security, IAM and FinOps baselines.
Days 31–60 Architecture, Workload Placement and Contract Changes
Apply a workload placement framework (Cloud A, Cloud B, sovereign provider, on-prem/colo)
Classify workloads by latency, data residency, regulatory and cost sensitivity
Revisit enterprise agreements, savings plans and sovereign cloud contracts using new forecasts
Decide which workloads to optimize in place, which to re-platform to another cloud and which might be candidates for repatriation
For EU teams, this is where you start to align with the EU Data Act’s cloud switching and interoperability direction instead of fighting it.
Days 61–90 Automation, SLOs and Operating Model
Encode budget guardrails, tag policies and lifecycle hooks as code
Align SLOs/SLAs with cost targets (e.g., “this dashboard doesn’t need 99.99% uptime”)
Define a durable FinOps operating model: roles, rhythms, dashboards and KPIs
Plan a 12–18 month roadmap that ties cost optimization to performance, resilience and sovereignty
This is a natural point to bring in a partner like Mak It Solutions for a 90-day multi-cloud cost assessment or FinOps pilot tailored to your region (US, UK, DACH, wider EU), especially if your internal teams are bandwidth-constrained.
Concluding Remarks
In 2026, successful CIOs treat multi-cloud as a managed portfolio, not a side effect of acquisitions or shadow IT. FinOps discipline, workload placement and geo-aware compliance are the three pillars that turn multi-cloud from a line-item problem into a competitive advantage.
You don’t need a big-bang replatforming program. You need a repeatable multi-cloud cost optimization playbook that shrinks waste, improves unit economics and gives boards in New York, London, Berlin, Paris or Madrid a clear story on resilience and sovereignty.
Risks of “Do Nothing” with Multi-Cloud Spend
Ignoring multi-cloud cost performance doesn’t keep you “simple” it quietly drains budget from innovation. Left unattended, you accumulate:
Rising AI and GPU costs with no unit-cost targets
Commitments that don’t match actual usage
Architecture that bakes in unnecessary egress, latency and lock-in
Compliance and sovereignty gaps that regulators and customers will eventually notice
Next Steps for CIOs and FinOps Leaders
Within the next quarter, you can:
Run a multi-cloud cost and architecture audit.
Identify 3–5 candidate workloads for “optimize vs re-platform vs repatriate”.
Launch a 90-day FinOps roadmap with clear KPIs and dashboards.
Mak It Solutions can then help you extend that into a 12–18 month, geo-aware multi-cloud cost optimization strategy that your CFO, CISO and regulators can all live with.
Key Takeaways
Multi-cloud cost optimization in 2026 is about continuous alignment of spend, performance and risk, not just trimming bills.
FinOps teams should anchor decisions in unit economics and track cost per workload, environment and SLO tier.
Multi-cloud is usually more expensive by default; it becomes cheaper only with active governance of commitments, waste and workload placement.
EU rules like the Data Act and national regulators such as BaFin are shifting the economics of egress, cloud switching and sovereignty.
A 90-day roadmap baseline → architecture/placement → automation gives CIOs credible savings and better performance without panicked repatriation.
If your cloud bills are rising faster than revenue or you’re under pressure to “do something” about multi-cloud now is the time to act methodically, not reactively. Mak It Solutions can help you benchmark your current multi-cloud estate, design a FinOps-led multi-cloud cost optimization strategy and execute a 90-day pilot that shows real savings without breaking SLAs or compliance.
Ready to see what a disciplined multi-cloud cost optimization strategy looks like for your US, UK or EU workloads? Reach out to Mak It Solutions to schedule a focused multi-cloud cost assessment and roadmap workshop.( Click Here’s )
FAQs
Q : Is multi-cloud worth it for mid-sized enterprises in 2026, or is single-cloud still simpler and cheaper?
A : For many mid-sized enterprises, single-cloud is still simpler unless you have clear reasons regulation, resilience, vendor leverage or specific services to add more providers. Multi-cloud brings benefits, but also higher operational complexity, governance overhead and skills requirements. A good rule of thumb: start with a strong FinOps practice on one cloud, then add a second only when you can articulate the workload, regulatory or negotiation benefits in unit-economic terms.
Q : How do AI and GPU-heavy workloads change multi-cloud cost optimization decisions?
A : AI and GPU-heavy workloads make unit economics non-negotiable: you need to know the cost per training run, per inference and per active user. Different clouds have very different GPU pricing, discount programs and data locality options, so shifting a single AI pipeline can swing costs dramatically. At the same time, data gravity (where your training data lives) and egress fees can quickly eat any headline GPU savings. In 2026, most FinOps teams treat AI workloads as their own cost segment with dedicated dashboards and placement rules.
Q : Can sovereign cloud platforms in Europe actually reduce total cloud costs, or are they mainly about compliance?
A : European sovereign cloud and local providers are primarily adopted for compliance, data residency and digital sovereignty, but they can reduce total cost of ownership in certain scenarios. For example, local providers may offer competitive pricing for predictable workloads, simpler egress terms and shorter contract cycles. However, they may lack some advanced managed services or global reach, so you often end up with a hybrid: core regulated workloads on sovereign cloud, and less sensitive workloads on global hyperscalers. The key is to compare total workload cost and compliance risk, not just per-VM price.
Q : What KPIs should a FinOps team track to prove multi-cloud cost performance improvements to the CFO?
A : At minimum, track: (1) cloud TCO per key product or workload; (2) cost per transaction or active user; (3) cost per SLO/SLA tier; (4) effective discount rate across all providers; and (5) percentage of spend covered by rightsizing and automation (e.g., scheduled non-prod, autoscaling, spot). Pair these with trend charts (quarter-on-quarter) and show how savings tie back to decisions contract changes, architecture changes or governance improvements so finance leaders see cost optimization as a controllable lever, not a random variance.
Q : How often should we reassess workload placement between clouds, sovereign providers and on-prem in a dynamic 2026 environment?
A : Most mature teams run lightweight reviews monthly (for anomalies and new opportunities) and deeper workload placement reviews quarterly, aligned to roadmap and contract milestones. A heavier reassessment e.g., considering sovereign cloud, major repatriation or new regions typically happens annually or when a trigger occurs: major regulatory changes, big price shifts or a new AI or data strategy. Automating telemetry and tagging means these reviews can focus on decisions, not spreadsheet wrangling.