
Smarter Developer Productivity Metrics for Leaders
Smarter Developer Productivity Metrics for Leaders

Smarter Developer Productivity Metrics for Leaders
If you want better delivery speed without burning out your engineering team, the right developer productivity metrics matter. The smartest teams are no longer tracking visible activity like commit counts or lines of code. They are measuring delivery performance, quality, and developer experience together so they can ship faster, recover faster, and reduce friction across the engineering system.
The short answer is simple: useful developer productivity metrics focus on outcomes, reliability, and workflow friction at the team level. A practical starting point is DORA for delivery performance, then a few DevEx signals to show where tools, reviews, onboarding, or CI are slowing teams down.
For engineering leaders in the US, UK, and Europe, that approach is far more useful than vanity dashboards. It helps you improve time-to-market, release confidence, and engineering health without turning measurement into surveillance.
What Are Developer Productivity Metrics?
Developer productivity metrics show how effectively an engineering organization turns work into reliable software outcomes. In practice, they help answer a few important questions.
How quickly can teams move changes into production?
How often do releases create incidents or rework?
Where is friction slowing engineers down?
Are teams improving delivery without hurting quality?
That is why productivity is not the same as activity. A team can produce more pull requests, more commits, or more code and still create more rework, slower releases, and more instability. The better lens is system performance, not visible busyness.
Which Developer Productivity Metrics Matter Most in 2026?
The best developer productivity metrics in 2026 sit across three areas: delivery, quality, and developer experience.
Delivery metrics
Start with flow and release performance. These are still the most useful executive-level signals because they show whether software can move through the system quickly and predictably.
Key delivery metrics include.
Change lead time: how long it takes for a committed change to reach production
Deployment frequency: how often changes are deployed
Cycle time: how long work takes to move from start to done
DORA now frames software delivery performance through five metrics and groups them around throughput and instability, making it a strong baseline for modern engineering dashboards.
Quality metrics
Speed alone can hide a lot of damage. That is why quality and stability need equal weight.
Useful quality metrics include.
Change failure percentage
Failed deployment recovery time
Incident volume and severity
Escaped defects
Deployment rework rate
Rework is especially worth watching for SaaS and product teams that release frequently. On paper, throughput may look strong. In reality, the team may be stuck paying for avoidable fixes, support load, and rushed follow-up work. DORA’s current guidance explicitly includes deployment rework rate alongside the other core delivery metrics.
Developer experience metrics
This is where many bottlenecks finally become visible. When delivery slows down, the cause is often not effort. It is friction.
Look at signals such as.
Review wait time
Build and test wait time
Environment setup pain
Documentation quality
Cognitive load
Developer satisfaction
Atlassian’s developer experience research reported that 97% of developers lose significant time to inefficiencies, which is exactly why DevEx belongs in the same dashboard as delivery and quality.
DORA, SPACE, and DevEx: Which Framework Should You Use?
Most teams do not need to pick only one.
Use DORA for delivery performance
DORA is the best foundation when leadership wants a clean view of delivery speed, release stability, and operational reliability. It is simple enough for executive reporting and practical enough for platform and DevOps teams.
Use SPACE for a broader interpretation
SPACE is helpful when you want a more balanced view of productivity. It reminds leaders that productivity is not just output. It also includes satisfaction, collaboration, efficiency, and well-being. That matters in real product organizations where mentoring, architecture decisions, cross-team support, and incident response all affect results.
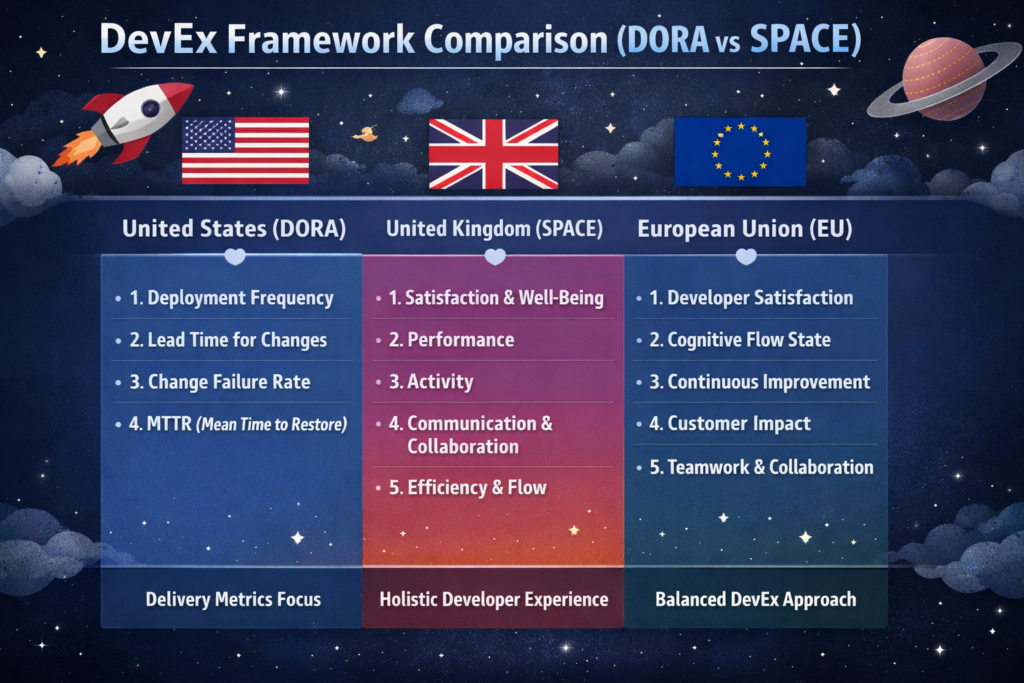
Use DevEx to find the real blockers
DevEx metrics are often the best improvement lens. They expose hidden issues such as slow CI, weak internal tooling, brittle environments, poor onboarding, or overloaded review queues. In practice, these are often the highest-ROI fixes because friction compounds across every team and every sprint.
A sensible model is this.
DORA for the baseline
SPACE for interpretation
DevEx for action
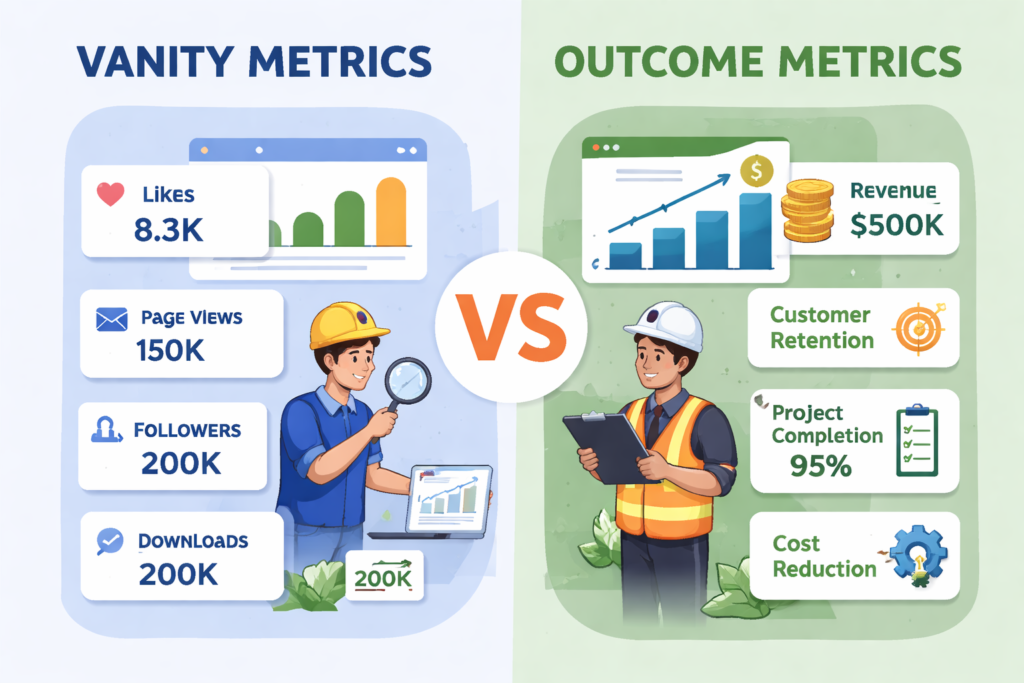
What Not to Measure
Some metrics look convenient but create terrible incentives.
Vanity metrics that mislead teams
Avoid using these as primary indicators of productivity.
Lines of code
Commit count
Pull request volume
Keyboard activity
Time online
These numbers are easy to collect, but they do not tell you whether the team shipped the right thing, whether the release was stable, or whether the system is becoming easier to work in. They also ignore debugging, design decisions, mentoring, documentation, and production support.
Why individual scorecards backfire
Once metrics turn into individual rankings, behavior changes fast. Engineers start optimizing for visibility instead of value. Collaboration drops. Safe work gets prioritized over important work. Review quality slips.
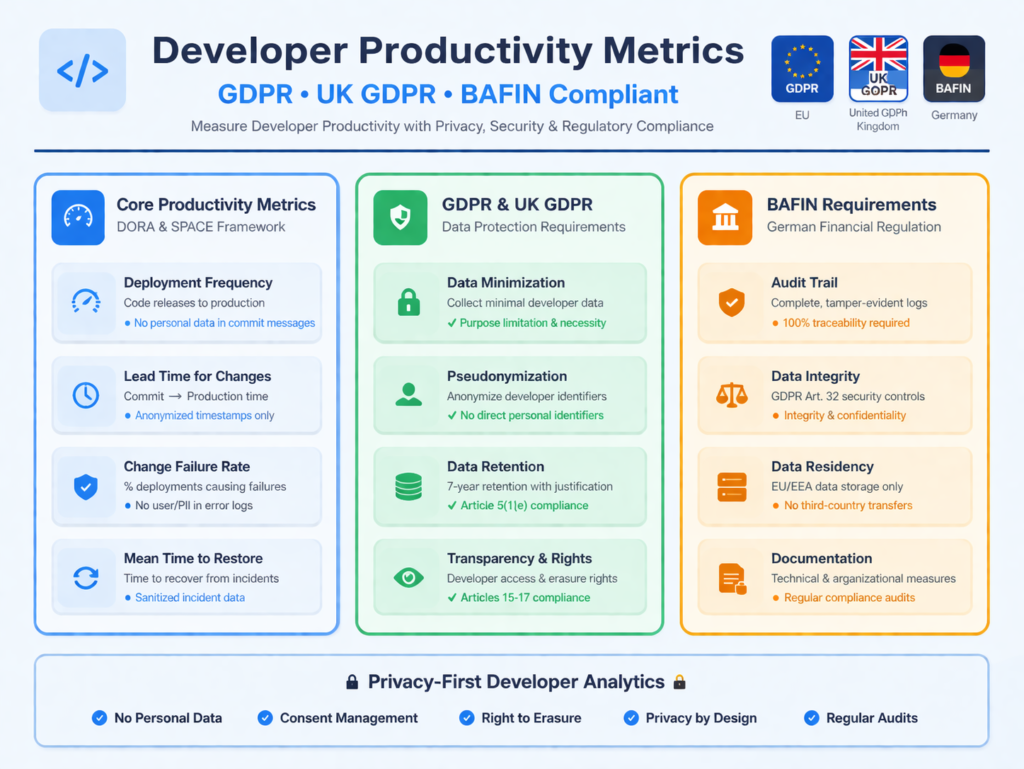
For UK and EU teams, there is also a governance issue. GDPR and UK GDPR principles emphasize lawfulness, fairness, transparency, and data minimisation, which makes surveillance-heavy monitoring much harder to justify.
For Germany and other privacy-sensitive environments, team-level reporting is usually the safer and more defensible choice.
How to Connect Engineering Metrics to Business Outcomes
This is where dashboards either become useful or decorative.
Strong developer productivity metrics should connect engineering performance to outcomes leadership actually cares about.
Faster time-to-market
Better release predictability
Fewer incidents
Lower rework cost
Better developer retention
Higher confidence in delivery
When change lead time drops, teams can test ideas faster. When recovery time improves, outages become less expensive. When review latency and CI wait times fall, teams regain capacity without hiring their way out of the problem.
For example, the UK open banking ecosystem has continued to grow rapidly. Open Banking Limited reported 16.5 million user connections by December 2025, showing how quickly digital financial services can scale when delivery and trust both improve.
In regulated sectors, reliability is also part of commercial credibility. The HIPAA Security Rule requires appropriate administrative, physical, and technical safeguards for ePHI, while PCI DSS provides a baseline of technical and operational requirements to protect payment account data.
That is why the best dashboard is not asking, “Who looks busy?” It is asking, “Where is the system slowing down, and what is that delay costing us?”
How US, UK, and EU Teams Should Adapt Their Metrics
The framework can stay similar across regions, but the emphasis changes.
US teams
US engineering leaders often care most about speed, leverage, and ROI. That is becoming even more relevant with AI-assisted delivery. In Stack Overflow’s 2024 Developer Survey, 76% of respondents said they were using or planning to use AI tools in development, and 62% said they were already using them.
So for US teams, it often makes sense to track.
Lead time
Deployment frequency
Rework
Review latency
AI-assisted workflow impact
UK teams
UK teams usually need a tighter link between engineering speed and compliance discipline. In fintech, health, and public-sector-adjacent delivery, the right dashboard should balance release pace with auditability, resilience, and privacy obligations under UK GDPR.
Germany and wider EU teams
In Germany and across the EU, personal monitoring is usually more sensitive from both a privacy and employee-relations perspective. GDPR principles still matter, and the EU AI Act entered into force on 1 August 2024, with major provisions applying on a phased timeline.
That makes team dashboards, aggregated reporting, and friction analysis much safer than individual monitoring. For teams in Berlin, Munich, Amsterdam, or Dublin, the goal should be clear system-level visibility without over-collecting personal data.
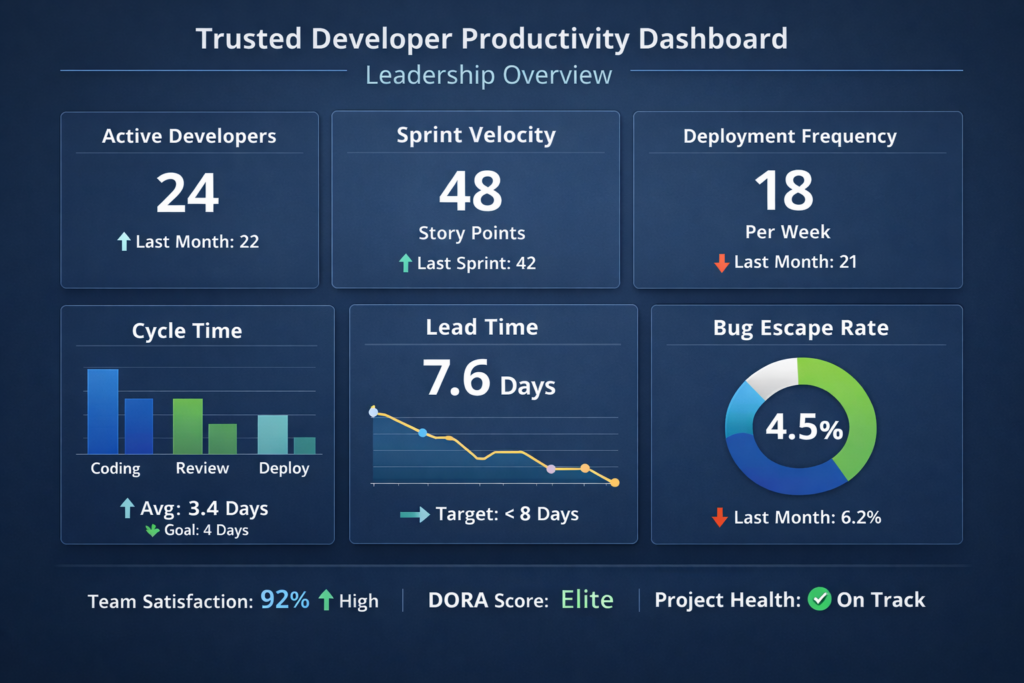
How to Build a Developer Productivity Dashboard Leaders Will Trust
The best dashboard is small, readable, and fair.
Start with a compact scorecard
A strong starting set is.
Change lead time
Deployment frequency
Change failure percentage
Failed deployment recovery time
One or two DevEx signals, such as review wait time or developer satisfaction
That gives leadership a useful snapshot without overwhelming the team.
Segment by bottleneck, not by person
Break metrics down by.
Team
Service
Product area
Workflow stage
Platform dependency
This helps you find the real issue. Maybe the slowdown is in approvals. Maybe it is CI. Maybe it is environment setup or cross-team review. Either way, you get something actionable instead of a misleading individual scoreboard.
Review monthly and pair metrics with qualitative feedback
Numbers tell you where to look. Engineers tell you why it is happening.
A monthly review cadence works well for most teams. Weekly checks can help with operational signals like incidents or release health, but strategic interpretation is usually stronger at the monthly level because it reduces noise and makes trend lines easier to trust.
Final Take
The best developer productivity metrics help leaders make better decisions. They show where work gets stuck, where quality is slipping, and where engineering friction is silently costing time and money.
Start with DORA. Add a small layer of DevEx. Remove vanity metrics from executive reporting. For most US, UK, and EU teams, that is the simplest way to build a measurement model that is fair, modern, and actually useful.( Click Here’s )
Key Takeaways
The best developer productivity metrics measure outcomes, quality, and friction together.
DORA is the strongest starting point for delivery performance.
DevEx metrics reveal hidden blockers that classic dashboards often miss.
SPACE helps leaders interpret productivity more fairly.
Vanity metrics such as lines of code and commit counts create bad incentives.
Team-level dashboards are usually more useful and more defensible than individual scorecards.
Regional context matters, especially across the US, UK, and EU.
FAQs
Q : What are the best developer productivity metrics for most software teams?
A : A strong starting point is change lead time, deployment frequency, change failure percentage, failed deployment recovery time, and one or two DevEx signals like review wait time or developer satisfaction. That gives you visibility into speed, stability, and friction without overcomplicating the dashboard.
Q : Are DORA metrics enough on their own?
A : Not always. DORA is excellent for software delivery performance, but it does not fully explain why teams are slow or frustrated. Adding DevEx signals helps you find bottlenecks in tools, onboarding, CI, reviews, and internal platforms.
Q : Why are lines of code a bad productivity metric?
A : Because more code does not automatically mean more value. Sometimes the most effective engineering work removes complexity, prevents incidents, or improves reliability without increasing visible output.
Q : How often should teams review developer productivity metrics?
A : For most organizations, a monthly review is the best rhythm for core metrics. Operational checks can happen weekly, but strategic decisions are usually better when based on trend lines rather than daily fluctuations.
Q : How should regulated teams measure productivity?
A : Regulated teams should combine delivery speed with stability, evidence, and privacy-safe reporting. That usually means DORA-style metrics plus incident trends, rework, and a few workflow-friction signals, while avoiding surveillance-style individual tracking. This is not legal or compliance advice; teams should validate their approach against their own regulatory obligations.
[…] businesses weigh build vs buy software, the real question is not whether custom development sounds more innovative. It is whether your company needs speed, flexibility, control, or a […]